Reebok 2010 Annual Report Download - page 138
Download and view the complete annual report
Please find page 138 of the 2010 Reebok annual report below. You can navigate through the pages in the report by either clicking on the pages listed below, or by using the keyword search tool below to find specific information within the annual report.-
 1
1 -
2
-
3
-
4
-
5
-
6
-
7
-
8
-
9
-
10
-
11
-
12
-
13
-
14
-
15
-
16
-
17
-
18
-
19
-
20
-
21
-
22
-
23
-
24
-
25
-
26
-
27
-
28
-
29
-
30
-
31
-
32
-
33
-
34
-
35
-
36
-
37
-
38
-
39
-
40
-
41
-
42
-
43
-
44
-
45
-
46
-
47
-
48
-
49
-
50
-
51
-
52
-
53
-
54
-
55
-
56
-
57
-
58
-
59
-
60
-
61
-
62
-
63
-
64
-
65
-
66
-
67
-
68
-
69
-
70
-
71
-
72
-
73
-
74
-
75
-
76
-
77
-
78
-
79
-
80
-
81
-
82
-
83
-
84
-
85
-
86
-
87
-
88
-
89
-
90
-
91
-
92
-
93
-
94
-
95
-
96
-
97
-
98
-
99
-
100
-
101
-
102
-
103
-
104
-
105
-
106
-
107
-
108
-
109
-
110
-
111
-
112
-
113
-
114
-
115
-
116
-
117
-
118
-
119
-
120
-
121
-
122
-
123
-
124
-
125
-
126
-
127
-
 128
128 -
 129
129 -
 130
130 -
 131
131 -
 132
132 -
 133
133 -
 134
134 -
 135
135 -
 136
136 -
 137
137 -
 138
138 -
 139
139 -
 140
140 -
 141
141 -
 142
142 -
 143
143 -
 144
144 -
 145
145 -
 146
146 -
 147
147 -
 148
148 -
149
-
150
-
151
-
152
-
153
-
154
-
155
-
156
-
157
-
158
-
159
-
160
-
161
-
162
-
163
-
164
-
165
-
166
-
167
-
168
-
169
-
170
-
171
-
172
-
173
-
174
-
175
-
176
-
177
-
178
-
179
-
180
-
181
-
182
-
183
-
184
-
185
-
186
-
187
-
188
-
189
-
190
-
191
-
192
-
193
-
194
-
195
-
196
-
197
-
198
-
199
-
200
-
201
-
202
-
203
-
204
-
205
-
206
-
207
-
208
-
209
-
210
-
211
-
212
-
213
-
214
-
215
-
216
-
217
-
218
-
219
-
220
-
221
-
222
-
223
-
224
-
225
-
226
-
227
-
228
-
229
-
230
-
231
-
232
-
233
-
234
-
235
-
236
-
237
-
238
-
239
-
240
-
241
-
242
-
243
-
244
-
245
-
246
-
247
-
248
 |
 |
134 Group Management Report – Financial Review Group Business Performance Income Statement
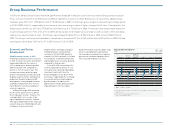
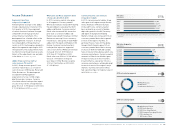
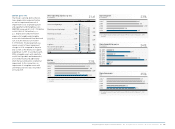
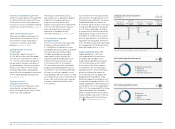
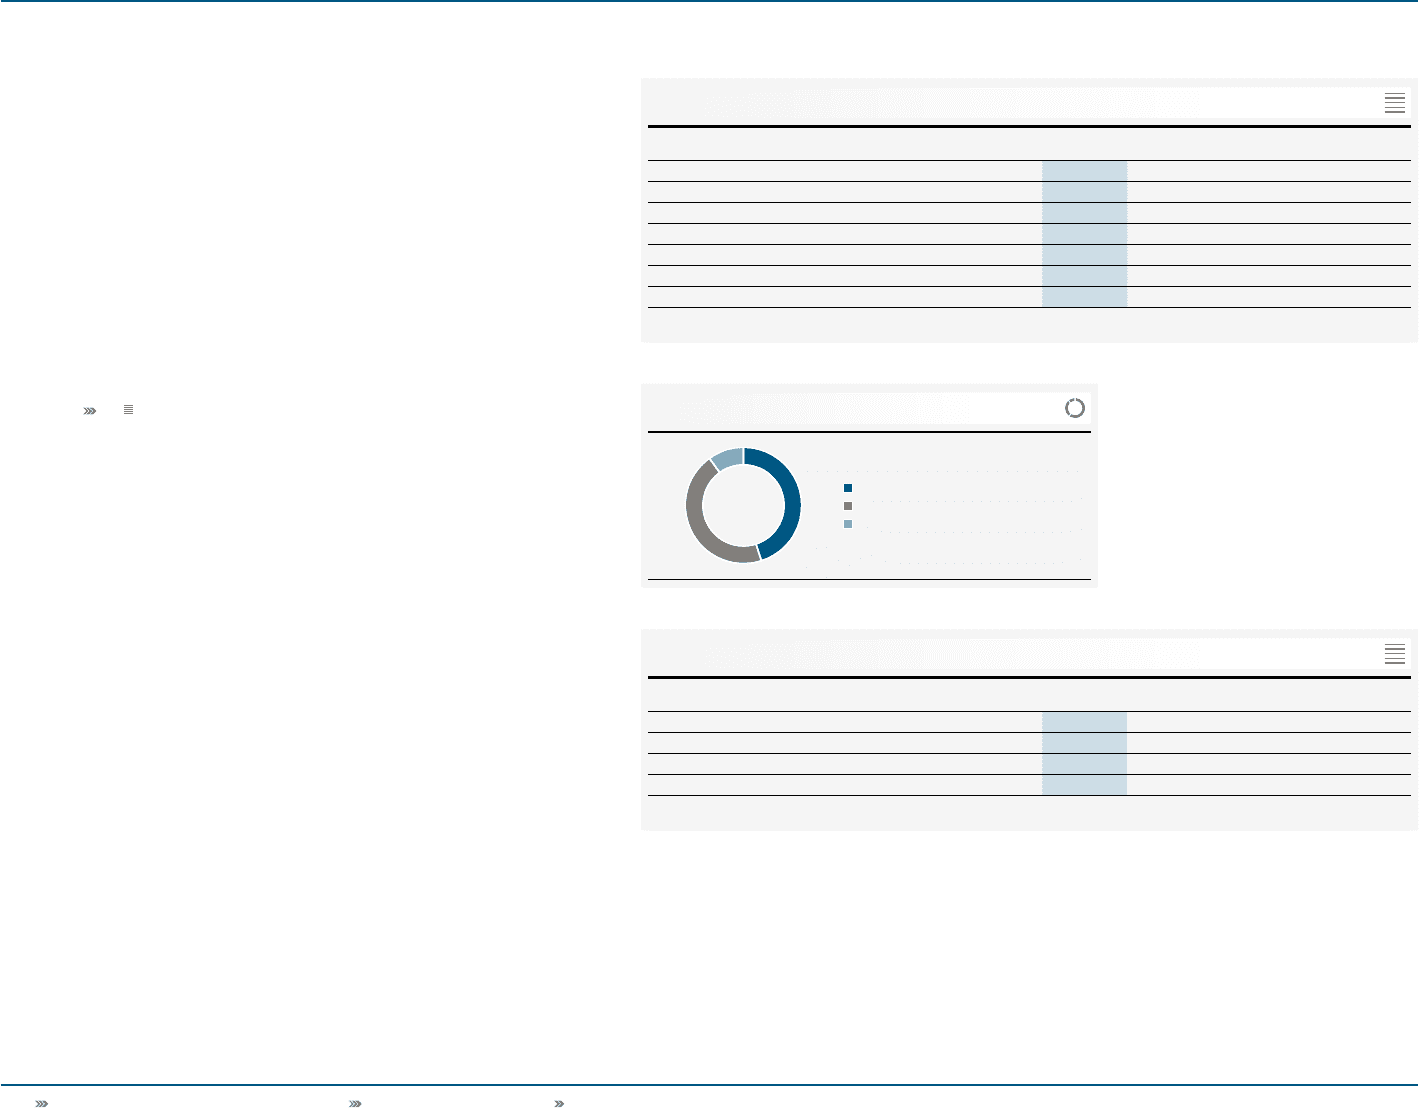
2010 net sales by product category 12
45% Footwear
45% Apparel
10% Hardware
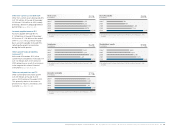
Group sales up in all product categories
In 2010, Group sales grew in all product
categories on a currency-neutral
basis. Currency-neutral footwear sales
increased 9% during the period. This
development was due to growth in the
football, running and outdoor categories.
Apparel revenues increased 9% on a
currency-neutral basis, driven by growth
in football, running and basketball.
Currency-neutral hardware sales
increased 5% compared to the prior year,
primarily due to strong growth in the
football category. Currency translation
effects had a positive impact on sales in
euro terms see 13.
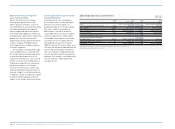
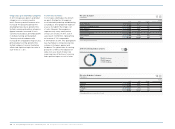
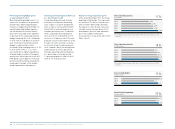
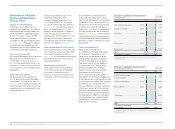
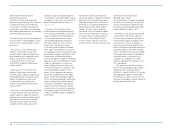
Net sales by region
€ in millions
2010 2009 Change Change
(currency-neutral)
Western Europe 3,543 3,261 9% 7%
European Emerging Markets 1,385 1,122 23% 16%
North America 2,805 2,362 19% 12%
Greater China 1,000 967 3% (2%)
Other Asian Markets 1,972 1,647 20% 6%
Latin America 1,285 1,006 28% 14%
Total 1 ) 11,990 10,381 15% 9%
1) Including HQ/Consolidation.
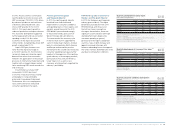
Net sales by product category
€ in millions
2010 2009 Change Change
(currency-neutral)
Footwear 5,389 4,642 16% 9%
Apparel 5,380 4,663 15% 9%
Hardware 1,221 1,076 14% 5%
Total 1 ) 11,990 10,381 15% 9%
1) Rounding differences may arise in totals.
11
13
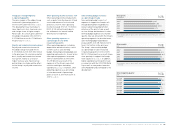
Cost of sales increases
Cost of sales is defined as the amount
we pay to third parties for expenses
associated with producing and delivering
our products. Own-production expenses
are also included in the Group’s cost
of sales. However, these expenses
represent only a very small portion
of total cost of sales. In 2010, cost of
sales was € 6.260 billion, representing
an increase of 10% compared to
€ 5.669 billion in 2009. This development
was mainly due to increasing sourcing
volumes in footwear, apparel and
hardware. The optimisation of sourcing
processes as well as the reduction of
input costs as a result of lower raw
material prices at the time of sourcing
had a positive impact on cost of sales.