Reebok 2010 Annual Report Download - page 195
Download and view the complete annual report
Please find page 195 of the 2010 Reebok annual report below. You can navigate through the pages in the report by either clicking on the pages listed below, or by using the keyword search tool below to find specific information within the annual report.-
 1
1 -
2
-
3
-
4
-
5
-
6
-
7
-
8
-
9
-
10
-
11
-
12
-
13
-
14
-
15
-
16
-
17
-
18
-
19
-
20
-
21
-
22
-
23
-
24
-
25
-
26
-
27
-
28
-
29
-
30
-
31
-
32
-
33
-
34
-
35
-
36
-
37
-
38
-
39
-
40
-
41
-
42
-
43
-
44
-
45
-
46
-
47
-
48
-
49
-
50
-
51
-
52
-
53
-
54
-
55
-
56
-
57
-
58
-
59
-
60
-
61
-
62
-
63
-
64
-
65
-
66
-
67
-
68
-
69
-
70
-
71
-
72
-
73
-
74
-
75
-
76
-
77
-
78
-
79
-
80
-
81
-
82
-
83
-
84
-
85
-
86
-
87
-
88
-
89
-
90
-
91
-
92
-
93
-
94
-
95
-
96
-
97
-
98
-
99
-
100
-
101
-
102
-
103
-
104
-
105
-
106
-
107
-
108
-
109
-
110
-
111
-
112
-
113
-
114
-
115
-
116
-
117
-
118
-
119
-
120
-
121
-
122
-
123
-
124
-
125
-
126
-
127
-
128
-
129
-
130
-
131
-
132
-
133
-
134
-
135
-
136
-
137
-
138
-
139
-
140
-
141
-
142
-
143
-
144
-
145
-
146
-
147
-
148
-
149
-
150
-
151
-
152
-
153
-
154
-
155
-
156
-
157
-
158
-
159
-
160
-
161
-
162
-
163
-
164
-
165
-
166
-
167
-
168
-
169
-
170
-
171
-
172
-
173
-
174
-
175
-
176
-
177
-
178
-
179
-
180
-
181
-
182
-
183
-
184
-
 185
185 -
 186
186 -
 187
187 -
 188
188 -
 189
189 -
 190
190 -
 191
191 -
 192
192 -
 193
193 -
 194
194 -
 195
195 -
 196
196 -
 197
197 -
 198
198 -
 199
199 -
 200
200 -
 201
201 -
 202
202 -
 203
203 -
 204
204 -
 205
205 -
206
-
207
-
208
-
209
-
210
-
211
-
212
-
213
-
214
-
215
-
216
-
217
-
218
-
219
-
220
-
221
-
222
-
223
-
224
-
225
-
226
-
227
-
228
-
229
-
230
-
231
-
232
-
233
-
234
-
235
-
236
-
237
-
238
-
239
-
240
-
241
-
242
-
243
-
244
-
245
-
246
-
247
-
248
 |
 |

Consolidated Financial Statements Notes 191
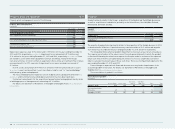
Certain derivative transactions, while providing effective economic hedges under the Group’s risk
management policies, may not qualify for hedge accounting under the specific rules of IAS 39.
Changes in the fair value of any derivative instruments that do not qualify for hedge accounting
under IAS 39 are recognised immediately in the income statement.
Hedges of net investments in foreign entities are accounted for in a similar way to cash flow
hedges. If, for example, the hedging instrument is a derivative (e.g. a forward contract) or, for
example, a foreign currency borrowing, effective currency gains and losses in the derivative and all
gains and losses arising on the translation of the borrowing, respectively, are recognised in equity.
The Group documents the relationship between hedging instruments and hedged items at
transaction inception, as well as the risk management objectives and strategies for undertaking
various hedge transactions. This process includes linking all derivatives designated as hedges
to specific firm commitments and forecasted transactions. The Group also documents its
assessment of whether the derivatives that are used in hedging transactions are highly effective
by using different methods of effectiveness testing, such as the “dollar offset method” or the
“hypothetical derivative method”.
The fair values of forward contracts and currency options are determined on the basis of
market conditions on the reporting dates. The fair value of a currency option is determined
using generally accepted models to calculate option prices. The fair market value of an option is
influenced not only by the remaining term of the option but also by additional factors, such as the
actual foreign exchange rate and the volatility of the underlying foreign currency base.
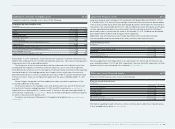
Cash and cash equivalents Cash and cash equivalents
Cash and cash equivalents represent cash and short-term bank deposits with maturities of three
months or less from the date of acquisition.
Cash equivalents are short-term, highly liquid investments that are readily convertible to
known amounts of cash and which are subject to an insignificant risk of changes in value.
Receivables and other financial assetsReceivables and other financial assets
Receivables and other financial assets are recognised at fair value, which is estimated as the
present value of future cash flows discounted at the market rate of interest at the balance sheet
date. Subsequently, these are measured at amortised cost using the “effective interest method”. If
necessary, required allowances are determined on the basis of individual risk assessment and of
the ageing structure of receivables past due.
Inventories Inventories
Merchandise and finished goods are valued at the lower of cost or net realisable value, which
is the estimated selling price in the ordinary course of business less the estimated costs of
completion and the estimated costs necessary to make the sale. Costs are determined using
a standard valuation method: the “average cost method”. Costs of finished goods include cost
of raw materials, direct labour and the components of the manufacturing overheads which can
reasonably be attributed. The allocation of overheads is based on the planned average utilisation.
The net realisable value allowances are computed consistently throughout the Group based on
the age and expected future sales of the items on hand.
Assets/liabilities classified as held for sale Assets/liabilities classified as held for sale
Assets and liabilities (primarily non-current) that are expected to be recovered principally through
sale rather than through continuing use are classified as held for sale. These are measured at the
lower of their carrying amount and fair value less costs to sell. A potential gain or loss is offset
against the carrying amount of the assets and liabilities classified as held for sale.
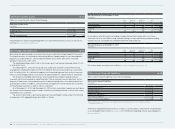
Property, plant and equipment Property, plant and equipment
Property, plant and equipment are measured at amortised cost. This comprises any costs directly
attributable to bringing the asset to the condition necessary for it to be capable of operating
in the manner intended by Management less accumulated depreciation (except for land and
construction in progress) and accumulated impairment losses. Depreciation is recognised
utilising the “straight-line method”, except where the “declining-balance method” is more
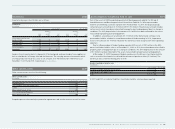
appropriate in light of the actual utilisation pattern. Estimated useful lives are as follows:
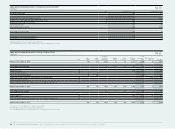
Estimated useful lives of property, plant and equipment
Years
Buildings/Leasehold improvements 5 – 50
Technical equipment and machinery as well as other equipment
and furniture and fittings 2 – 10
Expenditures for repairs and maintenance are expensed as incurred. Renewals and improvements
are capitalised and depreciated separately, if the recognition criteria are met.
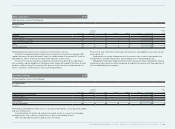
Impairment lossesImpairment losses
If facts and circumstances indicate that non-current assets (e.g. property, plant and equipment,
intangible assets including goodwill and certain financial assets) might be impaired, the
recoverable amount is determined. It is measured as the higher of its fair value less costs to sell
and value in use. An impairment loss is recognised in other operating expenses if the carrying
amount exceeds the recoverable amount. If there is an impairment loss for a cash-generating
unit, first the carrying amount of any goodwill allocated to the cash-generating unit is reduced,
and subsequently the other non-current assets of the unit are reduced pro rata on the basis of the
carrying amount of each asset in the unit.
Irrespective of whether there is an impairment indication, intangible assets with an indefinite
useful life and goodwill acquired in business combinations are tested annually for impairment.
An impairment loss recognised in goodwill is not reversible. With respect to all other impaired
assets, an impairment loss recognised in prior periods is reversed affecting the income statement
if there has been a change in the estimates used to determine the recoverable amount. An
impairment loss is reversed only to the extent that the asset’s carrying amount does not exceed
the carrying amount that would have been determined (net of depreciation or amortisation) if no
impairment loss had been recognised.