Reebok 2010 Annual Report Download - page 157
Download and view the complete annual report
Please find page 157 of the 2010 Reebok annual report below. You can navigate through the pages in the report by either clicking on the pages listed below, or by using the keyword search tool below to find specific information within the annual report.-
 1
1 -
2
-
3
-
4
-
5
-
6
-
7
-
8
-
9
-
10
-
11
-
12
-
13
-
14
-
15
-
16
-
17
-
18
-
19
-
20
-
21
-
22
-
23
-
24
-
25
-
26
-
27
-
28
-
29
-
30
-
31
-
32
-
33
-
34
-
35
-
36
-
37
-
38
-
39
-
40
-
41
-
42
-
43
-
44
-
45
-
46
-
47
-
48
-
49
-
50
-
51
-
52
-
53
-
54
-
55
-
56
-
57
-
58
-
59
-
60
-
61
-
62
-
63
-
64
-
65
-
66
-
67
-
68
-
69
-
70
-
71
-
72
-
73
-
74
-
75
-
76
-
77
-
78
-
79
-
80
-
81
-
82
-
83
-
84
-
85
-
86
-
87
-
88
-
89
-
90
-
91
-
92
-
93
-
94
-
95
-
96
-
97
-
98
-
99
-
100
-
101
-
102
-
103
-
104
-
105
-
106
-
107
-
108
-
109
-
110
-
111
-
112
-
113
-
114
-
115
-
116
-
117
-
118
-
119
-
120
-
121
-
122
-
123
-
124
-
125
-
126
-
127
-
128
-
129
-
130
-
131
-
132
-
133
-
134
-
135
-
136
-
137
-
138
-
139
-
140
-
141
-
142
-
143
-
144
-
145
-
146
-
 147
147 -
 148
148 -
 149
149 -
 150
150 -
 151
151 -
 152
152 -
 153
153 -
 154
154 -
 155
155 -
 156
156 -
 157
157 -
 158
158 -
 159
159 -
 160
160 -
 161
161 -
 162
162 -
 163
163 -
 164
164 -
 165
165 -
 166
166 -
 167
167 -
168
-
169
-
170
-
171
-
172
-
173
-
174
-
175
-
176
-
177
-
178
-
179
-
180
-
181
-
182
-
183
-
184
-
185
-
186
-
187
-
188
-
189
-
190
-
191
-
192
-
193
-
194
-
195
-
196
-
197
-
198
-
199
-
200
-
201
-
202
-
203
-
204
-
205
-
206
-
207
-
208
-
209
-
210
-
211
-
212
-
213
-
214
-
215
-
216
-
217
-
218
-
219
-
220
-
221
-
222
-
223
-
224
-
225
-
226
-
227
-
228
-
229
-
230
-
231
-
232
-
233
-
234
-
235
-
236
-
237
-
238
-
239
-
240
-
241
-
242
-
243
-
244
-
245
-
246
-
247
-
248
 |
 |
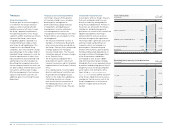
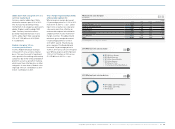
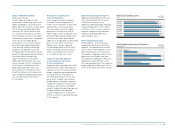
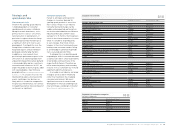
Group Management Report – Financial Review Business Performance by Segment Retail Business Performance 153
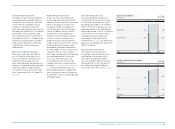
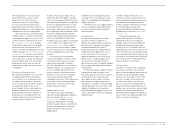
Retail at a glance
€ in millions
2010 2009 Change
Net sales 2,389 1,906 25%
Gross profit 1,476 1,116 32%
Gross margin 61.8% 58.6% 3.2pp
Segmental operating profit 452 259 74%
Segmental operating margin 18.9% 13.6% 5.3pp
08
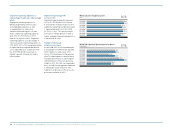
Retail net sales by quarter
€ in millions 10
Q1 2009
Q1 2010
Q2 2009
Q2 2010
Q3 2009
Q3 2010
Q4 2009
Q4 2010
400 459
486 602
524 665
497 664
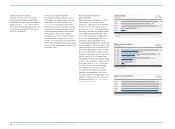
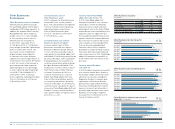
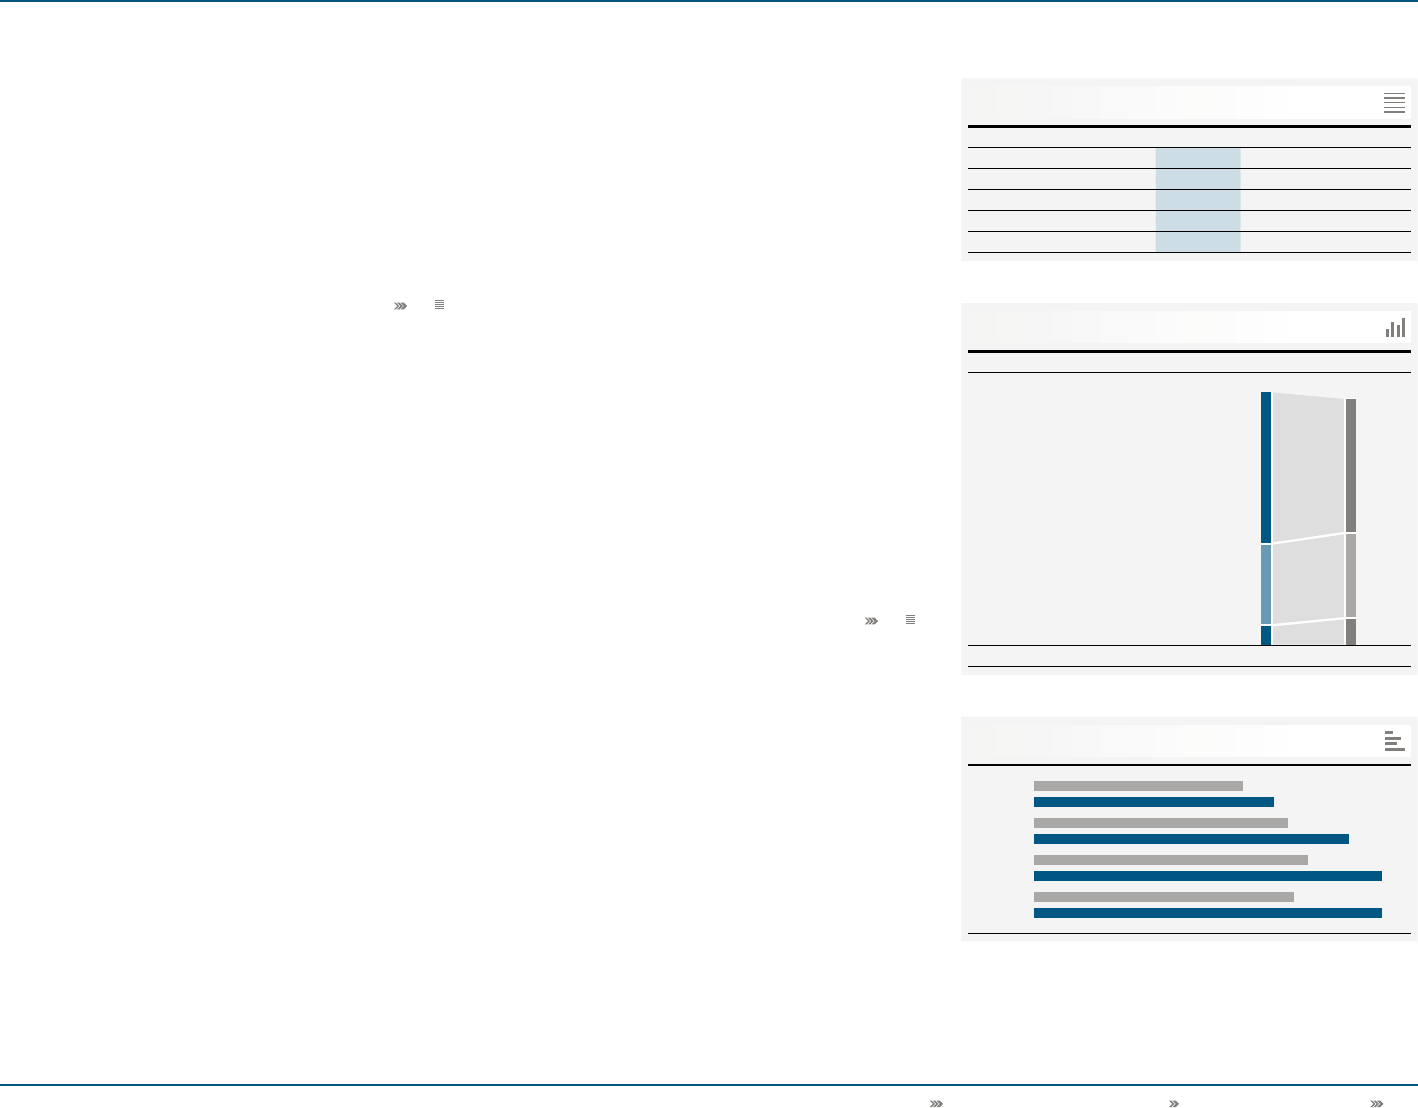
Retail number of stores
2010 2009
Total 2,270 2,212
09
Concept stores ...................1,352
Factory outlets ....................725
Other formats .....................193
1,203
755
254
Retail Business
Performance
Retail results in summary
The Retail segment comprises the
own-retail activities of the adidas and
Reebok brands. In 2010, currency-
neutral Retail sales increased 18%. In
euro terms, Retail sales grew 25% to
€ 2.389 billion (2009: € 1.906 billion).
Currency-neutral comparable store
sales were up 11% versus the prior year.
Gross margin increased 3.2 percentage
points to 61.8% (2009: 58.6%). This was
mainly a result of a higher proportion
of concept store sales at higher
margins and positive currency effects
related to the Russian rouble. Gross
profit increased 32% to € 1.476 billion
in 2010 from € 1.116 billion in 2009.
As a result of the increase in gross
margin and lower segmental operating
expenses as a percentage of sales,
segmental operating margin improved
5.3 percentage points to 18.9%
(2009: 13.6%). In absolute terms,
segmental operating profit grew
74% to € 452 million in 2010 versus
€ 259 million in 2009.
Currency-neutral segmental
sales grow 18%
In 2010, Retail revenues increased 18%
on a currency-neutral basis. Concept
store, factory outlet and other retail
format sales were all up versus the
prior year. Currency translation effects
positively impacted segmental revenues
in euro terms. Sales grew 25% to
€ 2.389 billion from € 1.906 billion in the
prior year see 08. Currency-neutral
comparable store sales rose 11% versus
the prior year, with increases in all store
formats.
Own-retail store base increases
At December 31, 2010, the adidas Group
Retail segment operated 2,270 stores.
This represents a net increase of 58 or
3% versus the prior year-end level of
2,212. Of the total number of stores, 1,712
were adidas and 558 Reebok branded
(December 31, 2009: 1,626 adidas stores,
586 Reebok stores). During 2010, the
Group opened 234 new stores, 127 stores
were closed, 51 stores were remodelled
and 49 stores were reclassified. The
reclassification is due to a different
methodology applied to store locations
which are co-shared by different Group
brands.
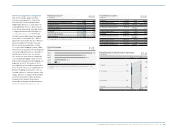
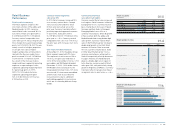
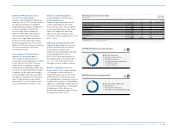
Currency-neutral Retail
sales grow in all regions
Currency-neutral Retail sales increased
in all regions. Retail revenues in Western
Europe grew 4% on a currency-neutral
basis, mainly due to increases in Spain,
Germany and Italy. Sales in European
Emerging Markets rose 30% on a
currency-neutral basis, driven by growth
in Russia where both the adidas and
Reebok brands had strong double-digit
sales growth. Currency-neutral Retail
sales in North America grew 14% due to
double-digit growth in the USA. Retail
revenues in Greater China increased
41% on a currency-neutral basis. Sales
in Other Asian Markets grew 1% on a
currency-neutral basis, with growth in
South Korea partially offset by decreases
in Japan. However, the Reebok brand
grew at a double-digit rate in Japan. In
Latin America, currency-neutral Retail
sales grew 34%, with particularly strong
growth in Argentina and Mexico. Currency
translation effects had a positive impact
on regional sales in euro terms see 11.