Reebok 2010 Annual Report Download - page 219
Download and view the complete annual report
Please find page 219 of the 2010 Reebok annual report below. You can navigate through the pages in the report by either clicking on the pages listed below, or by using the keyword search tool below to find specific information within the annual report.-
 1
1 -
2
-
3
-
4
-
5
-
6
-
7
-
8
-
9
-
10
-
11
-
12
-
13
-
14
-
15
-
16
-
17
-
18
-
19
-
20
-
21
-
22
-
23
-
24
-
25
-
26
-
27
-
28
-
29
-
30
-
31
-
32
-
33
-
34
-
35
-
36
-
37
-
38
-
39
-
40
-
41
-
42
-
43
-
44
-
45
-
46
-
47
-
48
-
49
-
50
-
51
-
52
-
53
-
54
-
55
-
56
-
57
-
58
-
59
-
60
-
61
-
62
-
63
-
64
-
65
-
66
-
67
-
68
-
69
-
70
-
71
-
72
-
73
-
74
-
75
-
76
-
77
-
78
-
79
-
80
-
81
-
82
-
83
-
84
-
85
-
86
-
87
-
88
-
89
-
90
-
91
-
92
-
93
-
94
-
95
-
96
-
97
-
98
-
99
-
100
-
101
-
102
-
103
-
104
-
105
-
106
-
107
-
108
-
109
-
110
-
111
-
112
-
113
-
114
-
115
-
116
-
117
-
118
-
119
-
120
-
121
-
122
-
123
-
124
-
125
-
126
-
127
-
128
-
129
-
130
-
131
-
132
-
133
-
134
-
135
-
136
-
137
-
138
-
139
-
140
-
141
-
142
-
143
-
144
-
145
-
146
-
147
-
148
-
149
-
150
-
151
-
152
-
153
-
154
-
155
-
156
-
157
-
158
-
159
-
160
-
161
-
162
-
163
-
164
-
165
-
166
-
167
-
168
-
169
-
170
-
171
-
172
-
173
-
174
-
175
-
176
-
177
-
178
-
179
-
180
-
181
-
182
-
183
-
184
-
185
-
186
-
187
-
188
-
189
-
190
-
191
-
192
-
193
-
194
-
195
-
196
-
197
-
198
-
199
-
200
-
201
-
202
-
203
-
204
-
205
-
206
-
207
-
208
-
 209
209 -
 210
210 -
 211
211 -
 212
212 -
 213
213 -
 214
214 -
 215
215 -
 216
216 -
 217
217 -
 218
218 -
 219
219 -
 220
220 -
 221
221 -
 222
222 -
 223
223 -
 224
224 -
 225
225 -
 226
226 -
 227
227 -
 228
228 -
 229
229 -
230
-
231
-
232
-
233
-
234
-
235
-
236
-
237
-
238
-
239
-
240
-
241
-
242
-
243
-
244
-
245
-
246
-
247
-
248
 |
 |
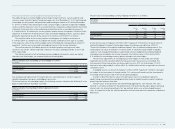
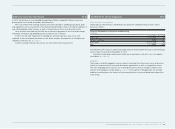
Consolidated Financial Statements Notes Notes to the Consolidated Income Statement 215
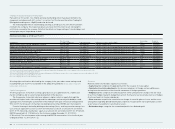
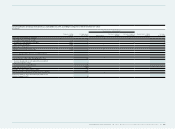
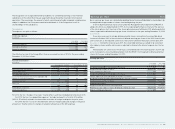
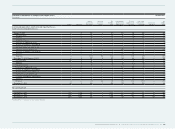
Other operating expenses
€ in millions
Year ending
Dec. 31, 2010 Year ending
Dec. 31, 2009
Marketing working budget 1,288 1,028
Sales working budget 308 241
Marketing overhead 1 ) 380 348
Sales force 1 ) 1,496 1,296
Logistics 1 ) 617 582
Research and development 1 ) 102 86
Central administration 1 ) 855 809
Other operating expenses 5,046 4,390
Thereof:
Depreciation, amortisation and impairment losses 260 294
1) Including mainly personnel and administration expenses.
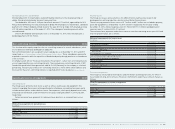
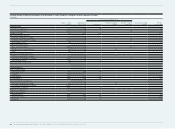
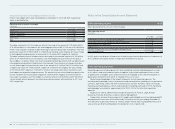
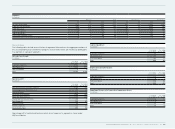
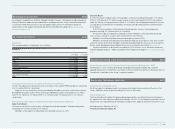
Cost by nature 31
Expenses are presented by function according to the “cost of sales method” in the income
statement. Supplementary information on the expenses by nature is detailed below.
Cost of materials Cost of materials
The total cost of materials relating to the amount of inventories recognised as an expense during
the period was € 6.165 billion and € 5.546 billion for the years ending December 31, 2010 and
2009, respectively.
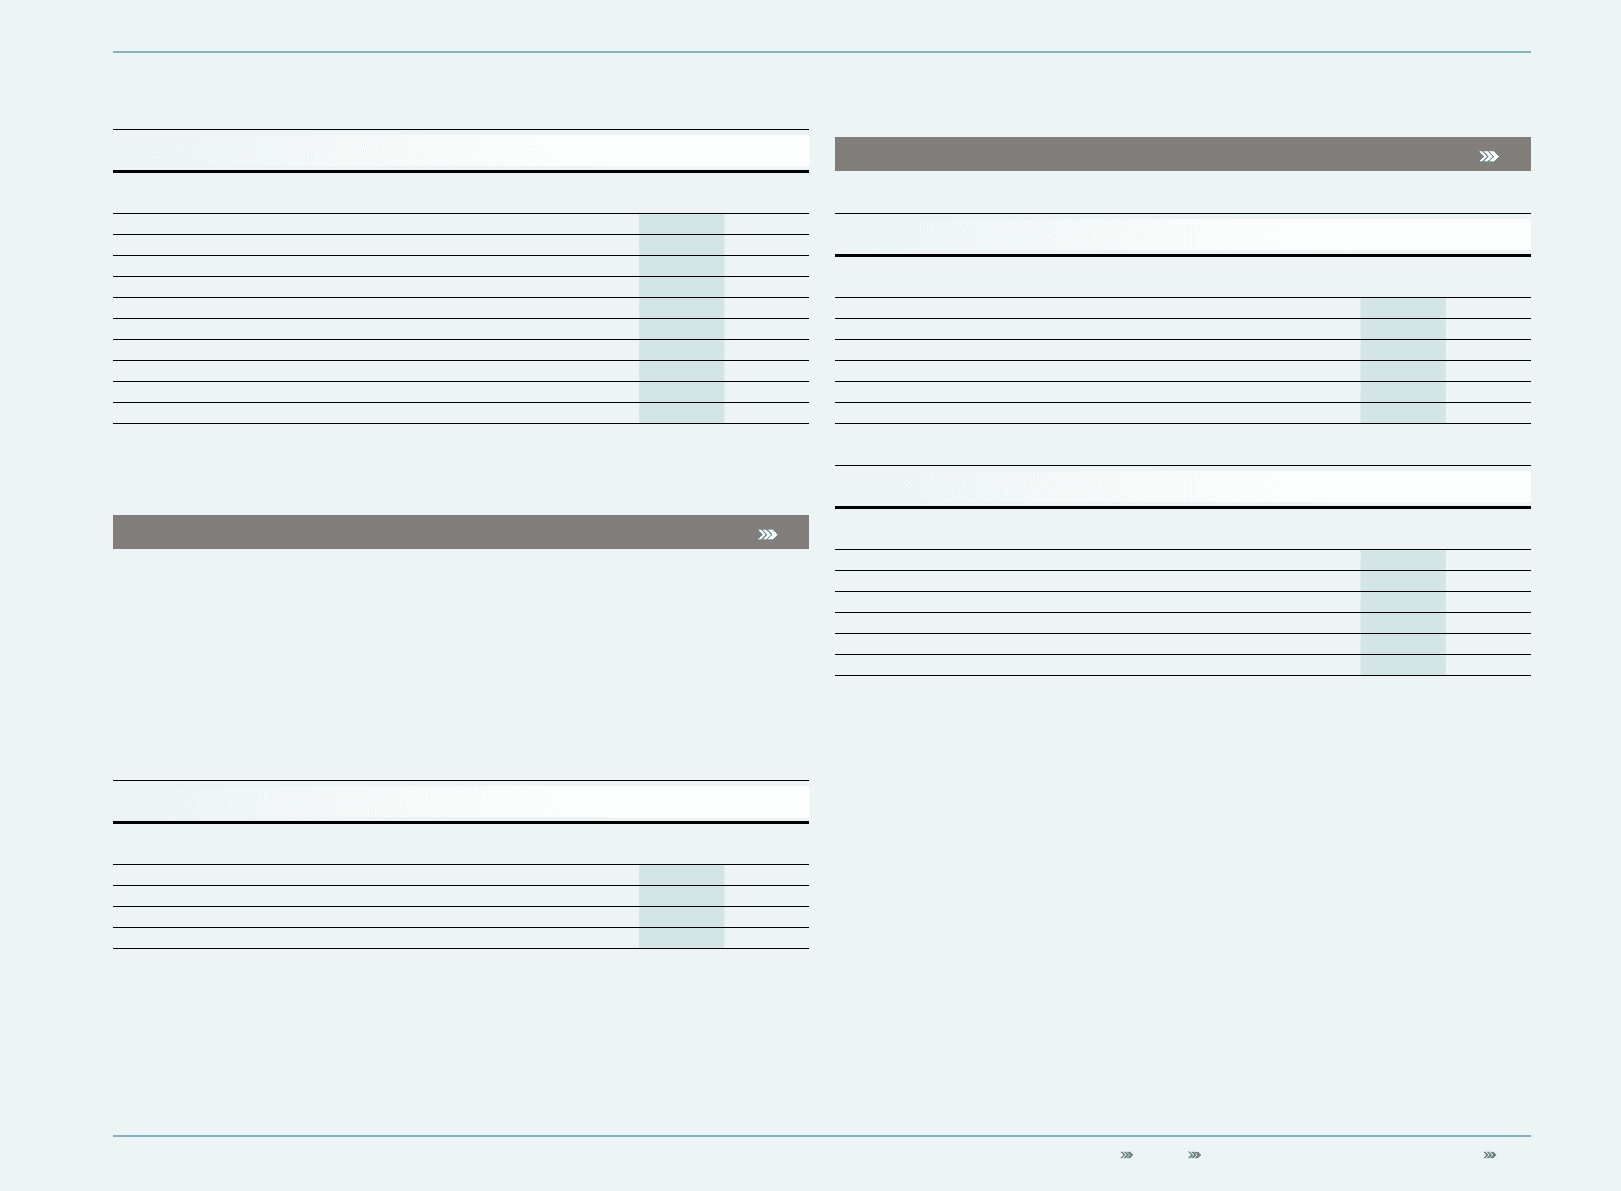
Personnel expensesPersonnel expenses
Personnel expenses were as follows:
Personnel expenses
€ in millions
Year ending
Dec. 31, 2010 Year ending
Dec. 31, 2009
Wages and salaries 1,338 1,185
Social security contributions 132 114
Pension expenses 51 53
Personnel expenses 1,521 1,352
Personnel expenses are primarily included within other operating expenses. Personnel expenses
which are directly attributable to the production costs of goods are included within the cost of
sales.
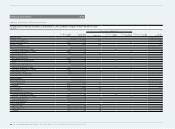
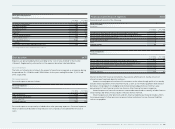
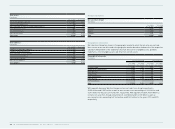
Financial income/financial expenses 32
Financial result consists of the following:
Financial income
€ in millions
Year ending
Dec. 31, 2010 Year ending
Dec. 31, 2009
Interest income from financial instruments measured at amortised cost 16 11
Interest income from financial instruments at fair value through profit or loss 7 5
Interest income from non-financial assets 0 —
Net foreign exchange gains 2 —
Other 0 3
Financial income 25 19
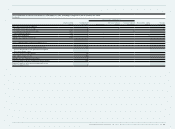
Financial expenses
€ in millions
Year ending
Dec. 31, 2010 Year ending
Dec. 31, 2009
Interest expense on financial instruments measured at amortised cost 112 138
Interest expense on financial instruments at fair value through profit or loss 0 —
Interest expense on other provisions and non-financial liabilities 0 —
Net foreign exchange losses — 25
Other 1 6
Financial expenses 113 169
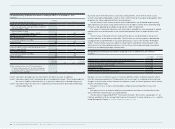
Interest income from financial instruments, measured at amortised cost, mainly consists of
interest income from bank deposits and loans.
Interest income/expense from financial instruments at fair value through profit or loss mainly
includes interest payments from investment funds as well as net interest payments from interest
derivatives not being part of a hedging relationship. Unrealised gains/losses from fair value
measurement of such financial assets are shown in other financial income or expenses.
Interest expense on financial instruments measured at amortised cost mainly includes interest
on borrowings and effects from using the “effective interest method”.
Interest expense on other provisions and non-financial liabilities particularly includes effects
from measurement of other provisions at present value and interest on non-financial liabilities
such as tax payables.