Reebok 2010 Annual Report Download - page 155
Download and view the complete annual report
Please find page 155 of the 2010 Reebok annual report below. You can navigate through the pages in the report by either clicking on the pages listed below, or by using the keyword search tool below to find specific information within the annual report.-
 1
1 -
2
-
3
-
4
-
5
-
6
-
7
-
8
-
9
-
10
-
11
-
12
-
13
-
14
-
15
-
16
-
17
-
18
-
19
-
20
-
21
-
22
-
23
-
24
-
25
-
26
-
27
-
28
-
29
-
30
-
31
-
32
-
33
-
34
-
35
-
36
-
37
-
38
-
39
-
40
-
41
-
42
-
43
-
44
-
45
-
46
-
47
-
48
-
49
-
50
-
51
-
52
-
53
-
54
-
55
-
56
-
57
-
58
-
59
-
60
-
61
-
62
-
63
-
64
-
65
-
66
-
67
-
68
-
69
-
70
-
71
-
72
-
73
-
74
-
75
-
76
-
77
-
78
-
79
-
80
-
81
-
82
-
83
-
84
-
85
-
86
-
87
-
88
-
89
-
90
-
91
-
92
-
93
-
94
-
95
-
96
-
97
-
98
-
99
-
100
-
101
-
102
-
103
-
104
-
105
-
106
-
107
-
108
-
109
-
110
-
111
-
112
-
113
-
114
-
115
-
116
-
117
-
118
-
119
-
120
-
121
-
122
-
123
-
124
-
125
-
126
-
127
-
128
-
129
-
130
-
131
-
132
-
133
-
134
-
135
-
136
-
137
-
138
-
139
-
140
-
141
-
142
-
143
-
144
-
 145
145 -
 146
146 -
 147
147 -
 148
148 -
 149
149 -
 150
150 -
 151
151 -
 152
152 -
 153
153 -
 154
154 -
 155
155 -
 156
156 -
 157
157 -
 158
158 -
 159
159 -
 160
160 -
 161
161 -
 162
162 -
 163
163 -
 164
164 -
 165
165 -
166
-
167
-
168
-
169
-
170
-
171
-
172
-
173
-
174
-
175
-
176
-
177
-
178
-
179
-
180
-
181
-
182
-
183
-
184
-
185
-
186
-
187
-
188
-
189
-
190
-
191
-
192
-
193
-
194
-
195
-
196
-
197
-
198
-
199
-
200
-
201
-
202
-
203
-
204
-
205
-
206
-
207
-
208
-
209
-
210
-
211
-
212
-
213
-
214
-
215
-
216
-
217
-
218
-
219
-
220
-
221
-
222
-
223
-
224
-
225
-
226
-
227
-
228
-
229
-
230
-
231
-
232
-
233
-
234
-
235
-
236
-
237
-
238
-
239
-
240
-
241
-
242
-
243
-
244
-
245
-
246
-
247
-
248
 |
 |
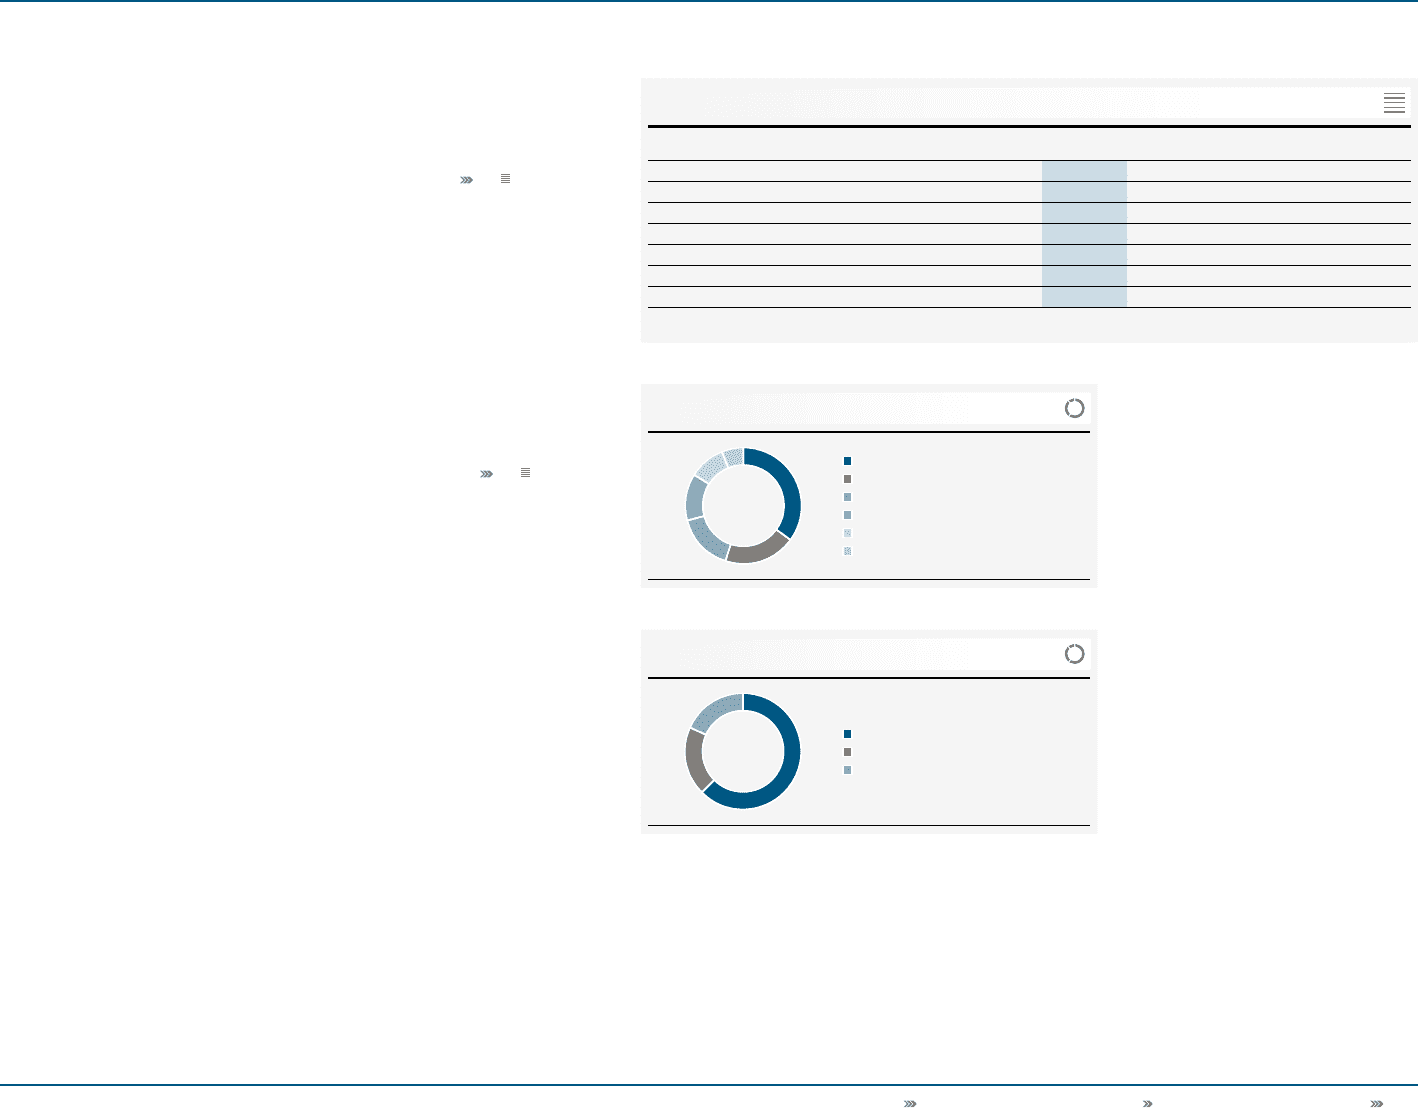
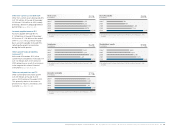
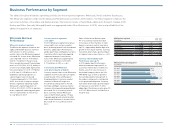
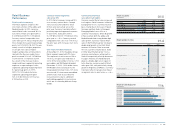
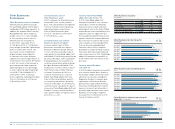
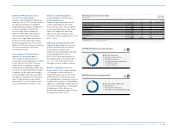
Group Management Report – Financial Review Business Performance by Segment Wholesale Business Performance 151
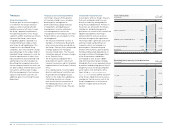
2010 Wholesale net sales by region
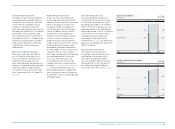
2010 Wholesale net sales by division
04
05
35% Western Europe
20% North America
16% Other Asian Markets
13% Latin America
10% Greater China
6% European Emerging Markets
63% adidas Sport Performance
19% adidas Sport Style
18% Reebok
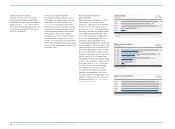
Wholesale net sales by region
€ in millions
2010 2009 Change Change
currency-neutral
Western Europe 2,882 2,633 9% 8%
European Emerging Markets 503 475 6% (2%)
North America 1,609 1,295 24% 17%
Greater China 840 855 (2%) (7%)
Other Asian Markets 1,270 1,041 22% 8%
Latin America 1,077 865 24% 11%
Total 1 ) 8,181 7,164 14% 8%
1) Rounding differences may arise in totals.
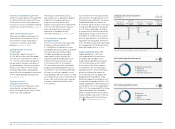
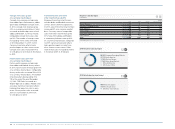
03
adidas Sport Style sales grow 21% on a
currency-neutral basis
Currency-neutral adidas Sport Style
wholesale revenues grew 21% in 2010.
This increase was driven by strong
momentum in all categories, particularly
adidas Originals and the adidas NEO
label. Currency translation effects
positively impacted revenues in euro
terms. adidas Sport Style sales grew
27% to € 1.559 billion in 2010 (2009:
€ 1.225 billion).
Reebok sales grow 12% on
a currency-neutral basis
In 2010, Reebok wholesale revenues
increased 12% on a currency-neutral
basis. This was the result of significant
sales growth in the walking and running
categories due to the toning and ZigTech
platforms as well as growth in training,
which more than offset declines in other
categories. In euro terms, Reebok sales
improved 19% to € 1.505 billion in 2010
from € 1.265 billion in 2009.
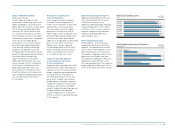
Gross margin negatively impacted by
unfavourable regional mix
Wholesale gross margin decreased
0.3 percentage points to 41.3% in 2010
from 41.6% in 2009 see 01. Lower
input costs as well as less clearance
sales were more than offset by an
unfavourable regional mix related to
a higher portion of sales from lower-
margin countries. The adidas brand
wholesale gross margin decreased
0.7 percentage points to 43.7% in
2010 (2009: 44.4%). The wholesale
gross margin of the Reebok brand
increased 2.4 percentage points to
30.8% in 2010 versus 28.4% in the prior
year. Wholesale gross profit improved
13% to € 3.379 billion in 2010 versus
€ 2.978 billion in 2009 see 01.