Reebok 2010 Annual Report Download - page 152
Download and view the complete annual report
Please find page 152 of the 2010 Reebok annual report below. You can navigate through the pages in the report by either clicking on the pages listed below, or by using the keyword search tool below to find specific information within the annual report.-
 1
1 -
2
-
3
-
4
-
5
-
6
-
7
-
8
-
9
-
10
-
11
-
12
-
13
-
14
-
15
-
16
-
17
-
18
-
19
-
20
-
21
-
22
-
23
-
24
-
25
-
26
-
27
-
28
-
29
-
30
-
31
-
32
-
33
-
34
-
35
-
36
-
37
-
38
-
39
-
40
-
41
-
42
-
43
-
44
-
45
-
46
-
47
-
48
-
49
-
50
-
51
-
52
-
53
-
54
-
55
-
56
-
57
-
58
-
59
-
60
-
61
-
62
-
63
-
64
-
65
-
66
-
67
-
68
-
69
-
70
-
71
-
72
-
73
-
74
-
75
-
76
-
77
-
78
-
79
-
80
-
81
-
82
-
83
-
84
-
85
-
86
-
87
-
88
-
89
-
90
-
91
-
92
-
93
-
94
-
95
-
96
-
97
-
98
-
99
-
100
-
101
-
102
-
103
-
104
-
105
-
106
-
107
-
108
-
109
-
110
-
111
-
112
-
113
-
114
-
115
-
116
-
117
-
118
-
119
-
120
-
121
-
122
-
123
-
124
-
125
-
126
-
127
-
128
-
129
-
130
-
131
-
132
-
133
-
134
-
135
-
136
-
137
-
138
-
139
-
140
-
141
-
 142
142 -
 143
143 -
 144
144 -
 145
145 -
 146
146 -
 147
147 -
 148
148 -
 149
149 -
 150
150 -
 151
151 -
 152
152 -
 153
153 -
 154
154 -
 155
155 -
 156
156 -
 157
157 -
 158
158 -
 159
159 -
 160
160 -
 161
161 -
 162
162 -
163
-
164
-
165
-
166
-
167
-
168
-
169
-
170
-
171
-
172
-
173
-
174
-
175
-
176
-
177
-
178
-
179
-
180
-
181
-
182
-
183
-
184
-
185
-
186
-
187
-
188
-
189
-
190
-
191
-
192
-
193
-
194
-
195
-
196
-
197
-
198
-
199
-
200
-
201
-
202
-
203
-
204
-
205
-
206
-
207
-
208
-
209
-
210
-
211
-
212
-
213
-
214
-
215
-
216
-
217
-
218
-
219
-
220
-
221
-
222
-
223
-
224
-
225
-
226
-
227
-
228
-
229
-
230
-
231
-
232
-
233
-
234
-
235
-
236
-
237
-
238
-
239
-
240
-
241
-
242
-
243
-
244
-
245
-
246
-
247
-
248
 |
 |
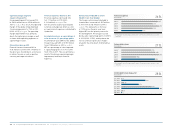
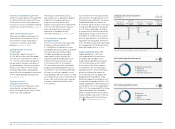
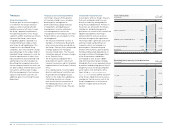
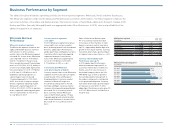
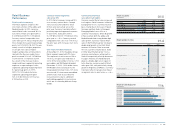
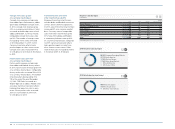
148 Group Management Report – Financial Review Group Business Performance Treasury
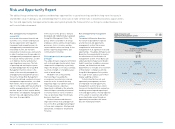
Net borrowings
€ in millions
1) Including Reebok, Rockport and Reebok-CCM Hockey from February 1, 2006
onwards.
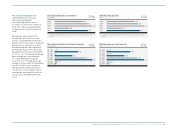
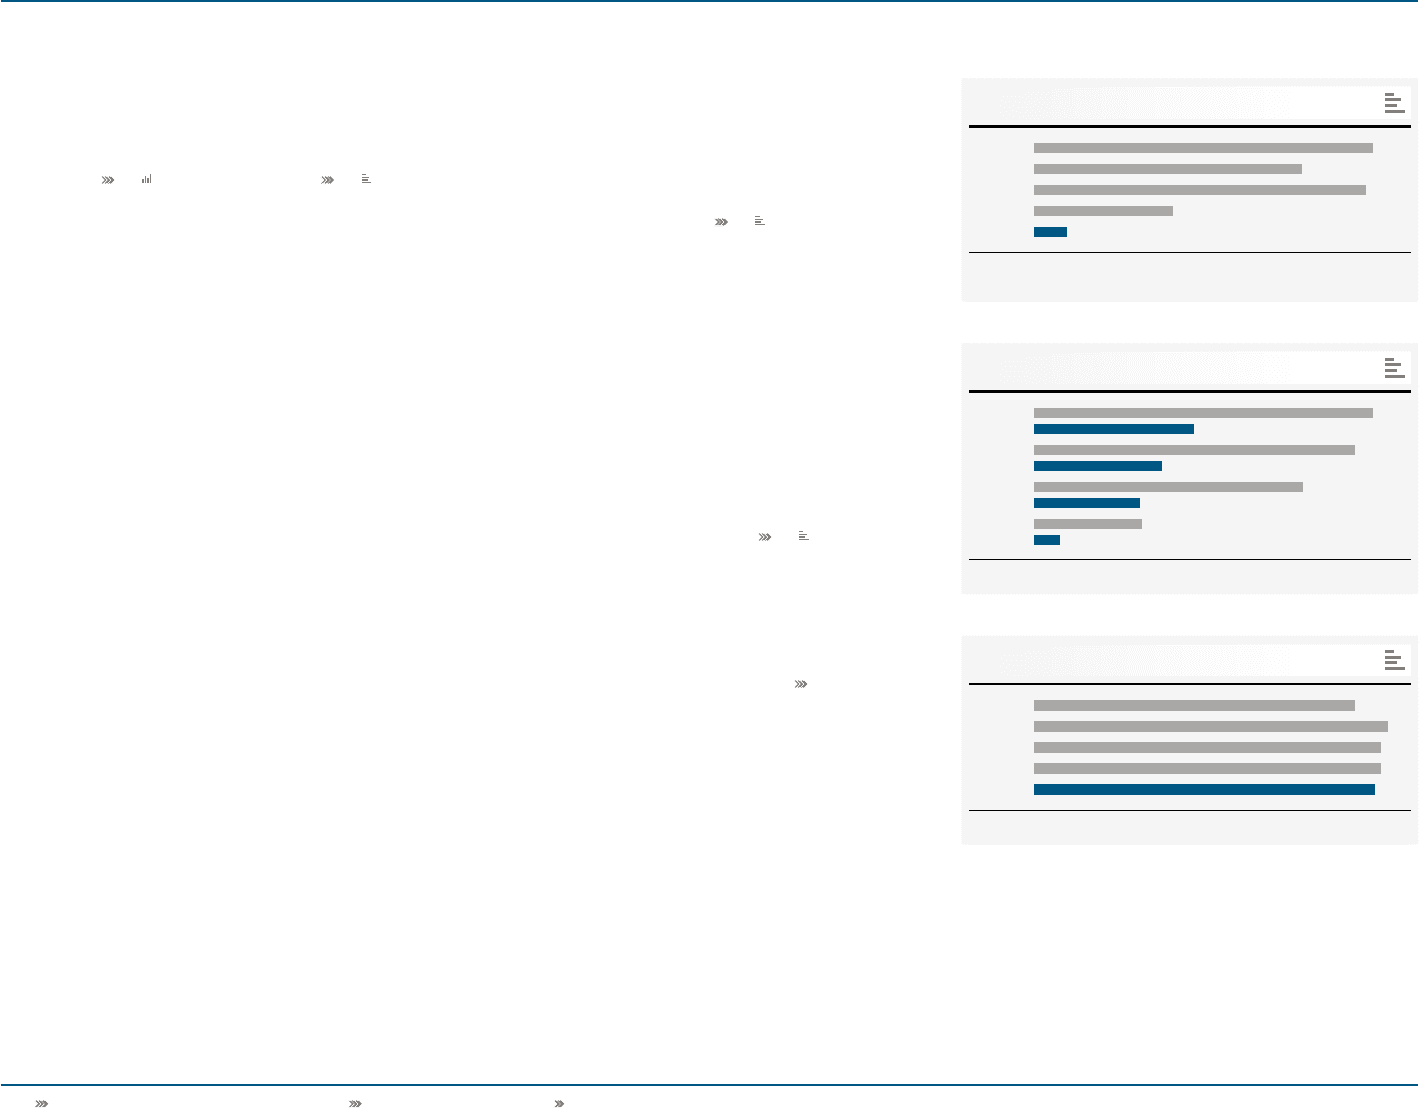
Interest rate development 1 )
in %
1) Weighted average interest rate of gross borrowings.
47
49
2006 1 )
2007
2008
2009
2010
2006
2007
2008
2009
2010
2,231
1,766
2,189
917
221
4.8
5.3
5.2
5.2
5.1
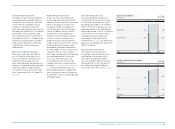
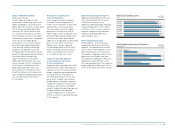
Net borrowings by quarter 1 )
€ in millions
1) At end of period.
48
Q1 2009
Q1 2010
Q2 2009
Q2 2010
Q3 2009
Q3 2010
Q4 2009
Q4 2010
2,883
1,359
2,732
1,090
2,294
903
917
221
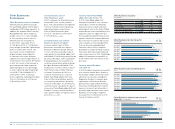
Stable debt maturity profile
Over the course of 2010, the Group’s
financing maturity profile remained
stable with the term structure of debt
evenly spread see 53. At the end of
2010, total refinancing needs in the next
12 months amounted to € 273 million
(2009: € 198 million).
Interest rate slightly improved
The weighted average interest rate on
the Group’s gross borrowings improved
slightly to 5.1% in 2010 (2009: 5.2%)
see 49. Positive effects from lower
interest rates on short-term borrowings
were partly offset by the higher share of
longer-term borrowings in the Group’s
financing mix, which carry a higher
average interest rate. Long-term fixed-
rate financing amounted to 76% of the
Group’s total financing at the end of 2010
(2009: 68%). Variable financing amounted
to 24% of total financing at the end of the
year (2009: 32%).
Net debt position decreases
by € 696 million
Net borrowings at December 31, 2010
amounted to € 221 million, which
represents a decrease of € 696 million,
or 76%, versus € 917 million in the
prior year see 47. This development
was fully in line with our original target
of net debt to be below the prior year
level communicated at the beginning
of 2010. Strong operating cash flow
and lower capital expenditure than
originally planned positively influenced
this development. Currency effects had
a positive impact of € 43 million on net
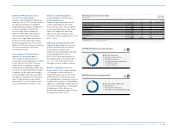
borrowings development. On a net debt
basis, the utilisation of credit facilities
available to the Group at the end of 2010
was 4% versus 16% in the prior year.
The Group’s financial leverage declined
to 4.8% at the end of 2010 versus 24.3%
in the prior year see 51. At the end
of 2010, the ratio of net borrowings
over EBITDA was 0.2 (ratio in 2009:
1.2) and thus well within the Group’s
medium-term guideline of less than
two times. Efficient management of our
capital structure continues to be a top
management priority see Subsequent
Events and Outlook, p. 174.