Reebok 2010 Annual Report Download - page 210
Download and view the complete annual report
Please find page 210 of the 2010 Reebok annual report below. You can navigate through the pages in the report by either clicking on the pages listed below, or by using the keyword search tool below to find specific information within the annual report.-
 1
1 -
2
-
3
-
4
-
5
-
6
-
7
-
8
-
9
-
10
-
11
-
12
-
13
-
14
-
15
-
16
-
17
-
18
-
19
-
20
-
21
-
22
-
23
-
24
-
25
-
26
-
27
-
28
-
29
-
30
-
31
-
32
-
33
-
34
-
35
-
36
-
37
-
38
-
39
-
40
-
41
-
42
-
43
-
44
-
45
-
46
-
47
-
48
-
49
-
50
-
51
-
52
-
53
-
54
-
55
-
56
-
57
-
58
-
59
-
60
-
61
-
62
-
63
-
64
-
65
-
66
-
67
-
68
-
69
-
70
-
71
-
72
-
73
-
74
-
75
-
76
-
77
-
78
-
79
-
80
-
81
-
82
-
83
-
84
-
85
-
86
-
87
-
88
-
89
-
90
-
91
-
92
-
93
-
94
-
95
-
96
-
97
-
98
-
99
-
100
-
101
-
102
-
103
-
104
-
105
-
106
-
107
-
108
-
109
-
110
-
111
-
112
-
113
-
114
-
115
-
116
-
117
-
118
-
119
-
120
-
121
-
122
-
123
-
124
-
125
-
126
-
127
-
128
-
129
-
130
-
131
-
132
-
133
-
134
-
135
-
136
-
137
-
138
-
139
-
140
-
141
-
142
-
143
-
144
-
145
-
146
-
147
-
148
-
149
-
150
-
151
-
152
-
153
-
154
-
155
-
156
-
157
-
158
-
159
-
160
-
161
-
162
-
163
-
164
-
165
-
166
-
167
-
168
-
169
-
170
-
171
-
172
-
173
-
174
-
175
-
176
-
177
-
178
-
179
-
180
-
181
-
182
-
183
-
184
-
185
-
186
-
187
-
188
-
189
-
190
-
191
-
192
-
193
-
194
-
195
-
196
-
197
-
198
-
199
-
 200
200 -
 201
201 -
 202
202 -
 203
203 -
 204
204 -
 205
205 -
 206
206 -
 207
207 -
 208
208 -
 209
209 -
 210
210 -
 211
211 -
 212
212 -
 213
213 -
 214
214 -
 215
215 -
 216
216 -
 217
217 -
 218
218 -
 219
219 -
 220
220 -
221
-
222
-
223
-
224
-
225
-
226
-
227
-
228
-
229
-
230
-
231
-
232
-
233
-
234
-
235
-
236
-
237
-
238
-
239
-
240
-
241
-
242
-
243
-
244
-
245
-
246
-
247
-
248
 |
 |

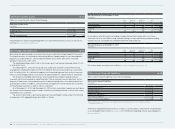
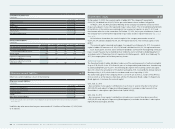
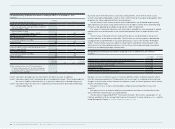
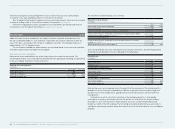
206 Consolidated Financial Statements Notes Notes to the Consolidated Statement of Financial Position
Changes in the percentage of voting rightsChanges in the percentage of voting rights
Pursuant to § 160 section 1 no. 8 AktG, existing shareholdings which have been notified to the
company in accordance with § 21 section 1 or section 1a of the German Securities Trading Act
(Wertpapierhandelsgesetz – WpHG) need to be disclosed.
The following table reflects shareholdings existing as at February 15, 2011 which have been
notified to the company. The respective details are taken from the most recent voting rights
notification received by the company. Note that the details on the percentage of shareholdings and
voting rights may no longer be up-to-date.
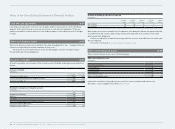
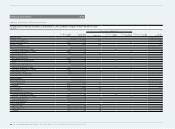
Existing shareholdings as at February 15, 2011
Notifying party Date of reaching,
exceeding or falling below Reporting threshold Attribution in accordance with § 22 WpHG Shareholdings
in % Number of
voting rights
Walter Scott & Partners Limited, Edinburgh, Scotland 1 ) June 25, 2010 Exceeding 3% § 22 sec. 1 sent. 1 no. 6 3.0096 6,296,653
Neptune LLC, Pittsburgh, USA 1 ) June 25, 2010 Exceeding 3% § 22 sec. 1 sent. 1 no. 6 in conjunction with § 22 sec. 1 sent. 2 3.0096 6,296,653
Mellon International Holdings S.A.R.L., Luxembourg, Luxembourg 1 ) June 25, 2010 Exceeding 3% § 22 sec. 1 sent. 1 no. 6 in conjunction with § 22 sec. 1 sent. 2 3.0096 6,296,653
BNY Mellon International Limited, London, UK 1 ) June 25, 2010 Exceeding 3% § 22 sec. 1 sent. 1 no. 6 in conjunction with § 22 sec. 1 sent. 2 3.0096 6,296,653
MBC Investments Corp., Greenville, USA 1 ) June 25, 2010 Exceeding 3% § 22 sec. 1 sent. 1 no. 6 in conjunction with § 22 sec. 1 sent. 2 3.1682 6,628,400
Euro Pacific Growth Fund, Los Angeles, USA 2 ) June 21, 2010 Falling below 3% — 2.95 6,178,394
BlackRock Financial Management, Inc., New York, USA 3 ) March 12, 2010 Exceeding 5% § 22 sec. 1 sent. 1 no. 6 in conjunction with § 22 sec. 1 sent. 2 5.03 10,533,558
BlackRock Holdco 2, Inc., Wilmington, Delaware, USA 3 ) March 12, 2010 Exceeding 5% § 22 sec. 1 sent. 1 no. 6 in conjunction with § 22 sec. 1 sent. 2 5.03 10,533,558
BlackRock, Inc., New York, USA 3 ) March 12, 2010 Exceeding 5% § 22 sec. 1 sent. 1 no. 6 in conjunction with § 22 sec. 1 sent. 2 5.21 10,904,232
The Bank of New York Mellon Corporation, New York, USA 4 ) March 12, 2010 Exceeding 3% § 22 sec. 1 sent. 1 no. 6 in conjunction with § 22 sec. 1 sent. 2 3.0745 6,432,398
Capital Research and Management Company, Los Angeles, USA 5 ) December 19, 2008 Exceeding 5% § 22 sec. 1 sent. 1 no. 6 5.01 9,695,127
1) Transmission of notification through The Bank of New York Mellon Corporation, Pittsburgh, USA; see the company’s disclosure dated July 23, 2010.
2) See the company’s disclosure dated June 28, 2010.
3) Transmission of notification through BlackRock Investment Management (UK) Limited, London, UK; see the company’s disclosure dated March 18, 2010.
4) See the company’s disclosure dated March 17, 2010.
5) See the company’s disclosure dated January 7, 2009.
All voting rights notifications disclosed by the company in the year under review and up to and
including February 15, 2011 are available on the adidas Group website www.adidas-Group.com/
voting_rights_notifications.
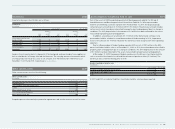
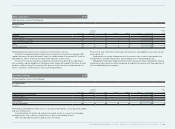
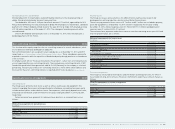
Capital management Capital management
The Group’s policy is to maintain a strong capital base so as to uphold investor, creditor and
market confidence and to sustain future development of the business.
The Group seeks to maintain a balance between a higher return on equity that might be
possible with higher levels of borrowings and the advantages and security afforded by a sound
capital position. Following the achievement of the medium-term goal of financial leverage below
50% in 2009, the Group aims to maintain net debt below two times EBITDA over the long term.
Financial leverage is derived by dividing net borrowings (short- and long-term borrowings less
cash and cash equivalents as well as short-term financial assets) in an amount of € 221 million
(2009: € 917 million) by shareholders’ equity in an amount of € 4.616 billion (2009: € 3.771 billion).
EBITDA amounted to € 1.159 billion for the fiscal year ending December 31, 2010 (2009:
€ 780 million). The ratio between net borrowings and EBITDA amounted to 0.2 for the fiscal year
ending December 31, 2010 (2009: 1.2).
Reserves Reserves
Reserves within shareholders’ equity are as follows:
– Capital reserve: comprises the paid premium for the issuance of share capital.
– Cumulative translation adjustments: this reserve comprises all foreign currency differences
arising from the translation of the financial statements of foreign operations.
– Hedging reserve: comprises the effective portion of the cumulative net change in the fair value
of cash flow hedges related to hedged transactions that have not yet occurred as well as of hedges
of net investments in foreign subsidiaries.
– Other reserves: comprise the cumulative net change of actuarial gains or losses and the asset
ceiling effect regarding defined benefit plans, expenses recognised for share option plans as well
as fair values of available-for-sale financial assets.
– Retained earnings: comprise the accumulated profits less dividends paid.