Reebok 2010 Annual Report Download - page 158
Download and view the complete annual report
Please find page 158 of the 2010 Reebok annual report below. You can navigate through the pages in the report by either clicking on the pages listed below, or by using the keyword search tool below to find specific information within the annual report.-
 1
1 -
2
-
3
-
4
-
5
-
6
-
7
-
8
-
9
-
10
-
11
-
12
-
13
-
14
-
15
-
16
-
17
-
18
-
19
-
20
-
21
-
22
-
23
-
24
-
25
-
26
-
27
-
28
-
29
-
30
-
31
-
32
-
33
-
34
-
35
-
36
-
37
-
38
-
39
-
40
-
41
-
42
-
43
-
44
-
45
-
46
-
47
-
48
-
49
-
50
-
51
-
52
-
53
-
54
-
55
-
56
-
57
-
58
-
59
-
60
-
61
-
62
-
63
-
64
-
65
-
66
-
67
-
68
-
69
-
70
-
71
-
72
-
73
-
74
-
75
-
76
-
77
-
78
-
79
-
80
-
81
-
82
-
83
-
84
-
85
-
86
-
87
-
88
-
89
-
90
-
91
-
92
-
93
-
94
-
95
-
96
-
97
-
98
-
99
-
100
-
101
-
102
-
103
-
104
-
105
-
106
-
107
-
108
-
109
-
110
-
111
-
112
-
113
-
114
-
115
-
116
-
117
-
118
-
119
-
120
-
121
-
122
-
123
-
124
-
125
-
126
-
127
-
128
-
129
-
130
-
131
-
132
-
133
-
134
-
135
-
136
-
137
-
138
-
139
-
140
-
141
-
142
-
143
-
144
-
145
-
146
-
147
-
 148
148 -
 149
149 -
 150
150 -
 151
151 -
 152
152 -
 153
153 -
 154
154 -
 155
155 -
 156
156 -
 157
157 -
 158
158 -
 159
159 -
 160
160 -
 161
161 -
 162
162 -
 163
163 -
 164
164 -
 165
165 -
 166
166 -
 167
167 -
 168
168 -
169
-
170
-
171
-
172
-
173
-
174
-
175
-
176
-
177
-
178
-
179
-
180
-
181
-
182
-
183
-
184
-
185
-
186
-
187
-
188
-
189
-
190
-
191
-
192
-
193
-
194
-
195
-
196
-
197
-
198
-
199
-
200
-
201
-
202
-
203
-
204
-
205
-
206
-
207
-
208
-
209
-
210
-
211
-
212
-
213
-
214
-
215
-
216
-
217
-
218
-
219
-
220
-
221
-
222
-
223
-
224
-
225
-
226
-
227
-
228
-
229
-
230
-
231
-
232
-
233
-
234
-
235
-
236
-
237
-
238
-
239
-
240
-
241
-
242
-
243
-
244
-
245
-
246
-
247
-
248
 |
 |
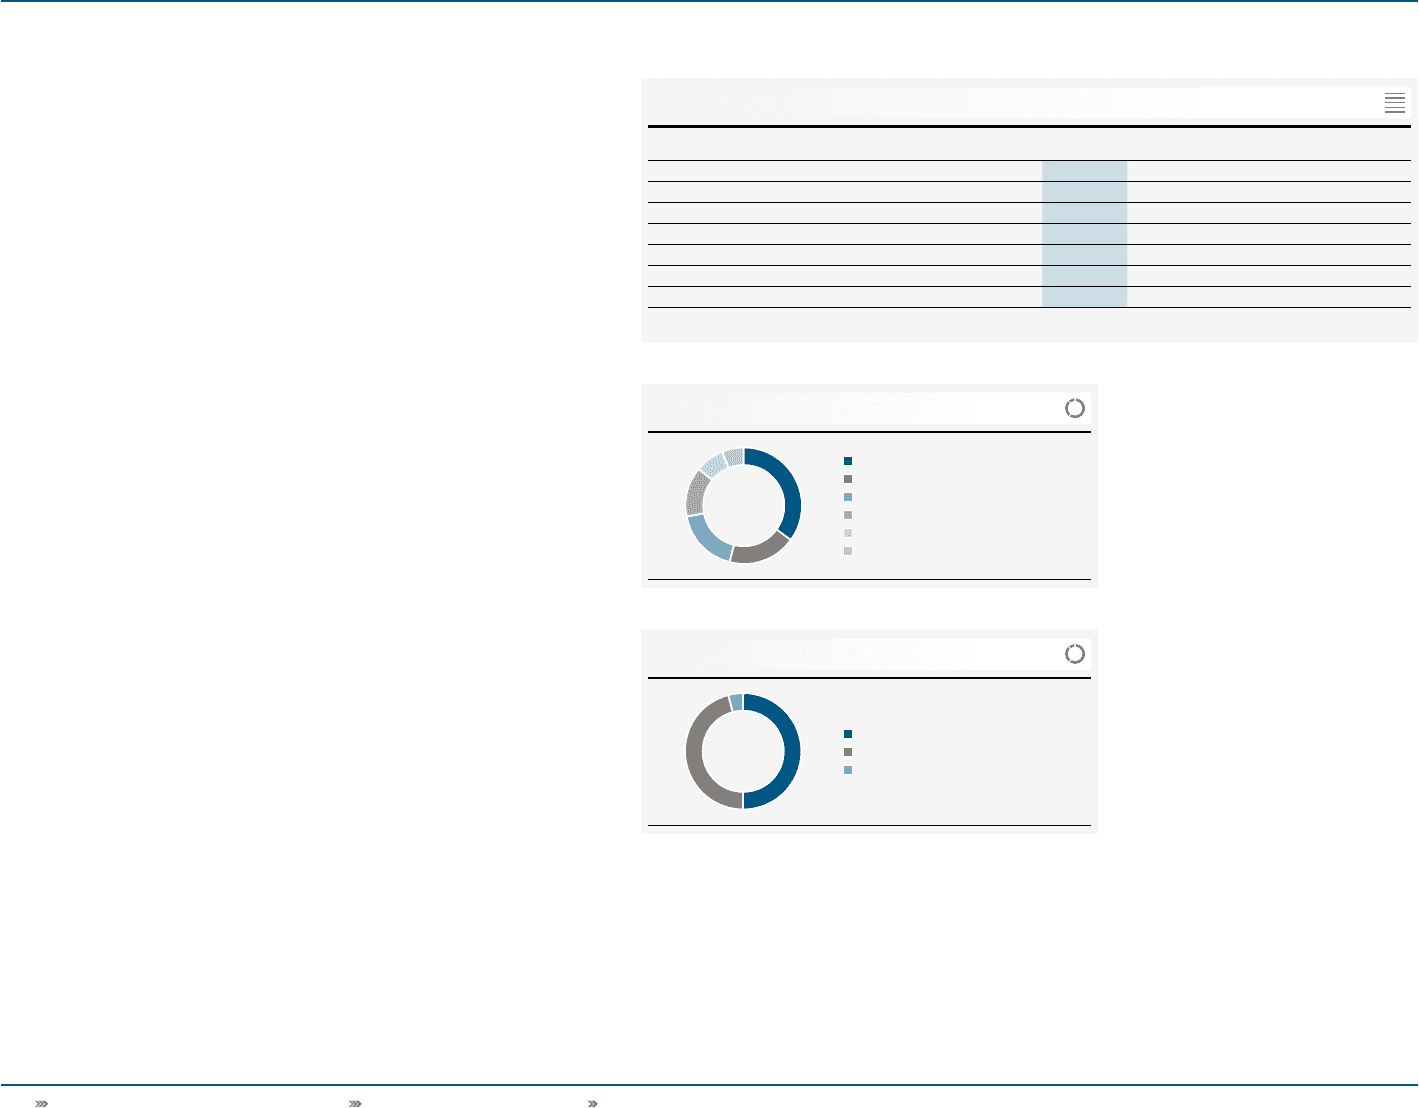
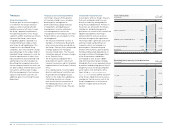
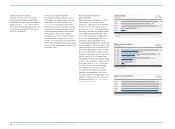
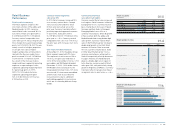
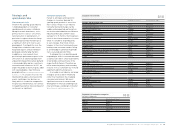
154 Group Management Report – Financial Review Business Performance by Segment Retail Business Performance
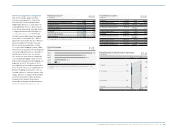
2010 Retail net sales by region
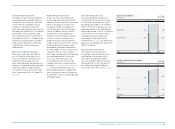
2010 Retail sales by store format
12
13
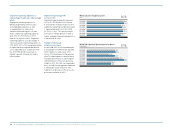
35% European Emerging Markets
19% North America
18% Western Europe
14% Other Asian Markets
8% Latin America
6% Greater China
50% Factory outlets
46% Concept stores
4% Other store formats
Retail net sales by region
€ in millions
2010 2009 Change Change
currency-neutral
Western Europe 426 405 5% 4%
European Emerging Markets 846 617 37% 30%
North America 461 380 21% 14%
Greater China 131 88 49% 41%
Other Asian Markets 330 286 15% 1%
Latin America 195 129 50% 34%
Total 1 ) 2,389 1,906 25% 18%
1) Rounding differences may arise in totals.
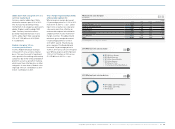
11
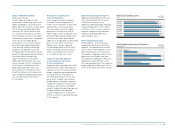
Concept store sales up 23%
on a currency-neutral basis
Concept store revenues include sales
from adidas Sport Performance, adidas
Sport Style and Reebok concept stores.
In 2010, concept store revenues grew
23% on a currency-neutral basis. Sales
increased at double-digit rates at both
adidas and Reebok. Currency-neutral
comparable concept store sales were
up 14%. The number of concept stores
increased by 149 to 1,352 at the end
of 2010 (December 31, 2009: 1,203).
Currency translation effects had a
positive impact on sales in euro terms.
Concept store sales increased 31% to
€ 1.094 billion in 2010 from € 833 million
in 2009.
Factory outlet sales grow 13%
on a currency-neutral basis
Factory outlet revenues include sales
from adidas and Reebok factory outlets.
In 2010, factory outlet revenues grew 13%
on a currency-neutral basis. Comparable
factory outlet sales increased 5% in 2010
on a currency-neutral basis. The number
of factory outlets decreased by 30 to
725 at the end of the year (December
31, 2009: 755). Sales increased at a
double-digit rate at adidas. Reebok sales
also grew. Currency translation effects
had a positive impact on sales in euro
terms. Factory outlet sales increased
20% to € 1.203 billion in 2010 from
€ 1.005 billion in 2009.
Currency-neutral sales from
other retail formats up 28%
Revenues from other retail formats
include adidas and Reebok concession
corners and e-commerce operations.
In 2010, sales from other retail formats
increased 28% on a currency-neutral
basis. Currency-neutral comparable
sales from other retail formats grew
63%. Sales from adidas and Reebok
e-commerce platforms were up 83%
on a currency-neutral basis compared
to 2009. Currency translation effects
had a positive impact on sales from
other formats in euro terms. Other
retail format sales increased by 35% to
€ 92 million (2009: € 68 million).