Reebok 2010 Annual Report Download - page 216
Download and view the complete annual report
Please find page 216 of the 2010 Reebok annual report below. You can navigate through the pages in the report by either clicking on the pages listed below, or by using the keyword search tool below to find specific information within the annual report.-
 1
1 -
2
-
3
-
4
-
5
-
6
-
7
-
8
-
9
-
10
-
11
-
12
-
13
-
14
-
15
-
16
-
17
-
18
-
19
-
20
-
21
-
22
-
23
-
24
-
25
-
26
-
27
-
28
-
29
-
30
-
31
-
32
-
33
-
34
-
35
-
36
-
37
-
38
-
39
-
40
-
41
-
42
-
43
-
44
-
45
-
46
-
47
-
48
-
49
-
50
-
51
-
52
-
53
-
54
-
55
-
56
-
57
-
58
-
59
-
60
-
61
-
62
-
63
-
64
-
65
-
66
-
67
-
68
-
69
-
70
-
71
-
72
-
73
-
74
-
75
-
76
-
77
-
78
-
79
-
80
-
81
-
82
-
83
-
84
-
85
-
86
-
87
-
88
-
89
-
90
-
91
-
92
-
93
-
94
-
95
-
96
-
97
-
98
-
99
-
100
-
101
-
102
-
103
-
104
-
105
-
106
-
107
-
108
-
109
-
110
-
111
-
112
-
113
-
114
-
115
-
116
-
117
-
118
-
119
-
120
-
121
-
122
-
123
-
124
-
125
-
126
-
127
-
128
-
129
-
130
-
131
-
132
-
133
-
134
-
135
-
136
-
137
-
138
-
139
-
140
-
141
-
142
-
143
-
144
-
145
-
146
-
147
-
148
-
149
-
150
-
151
-
152
-
153
-
154
-
155
-
156
-
157
-
158
-
159
-
160
-
161
-
162
-
163
-
164
-
165
-
166
-
167
-
168
-
169
-
170
-
171
-
172
-
173
-
174
-
175
-
176
-
177
-
178
-
179
-
180
-
181
-
182
-
183
-
184
-
185
-
186
-
187
-
188
-
189
-
190
-
191
-
192
-
193
-
194
-
195
-
196
-
197
-
198
-
199
-
200
-
201
-
202
-
203
-
204
-
205
-
 206
206 -
 207
207 -
 208
208 -
 209
209 -
 210
210 -
 211
211 -
 212
212 -
 213
213 -
 214
214 -
 215
215 -
 216
216 -
 217
217 -
 218
218 -
 219
219 -
 220
220 -
 221
221 -
 222
222 -
 223
223 -
 224
224 -
 225
225 -
 226
226 -
227
-
228
-
229
-
230
-
231
-
232
-
233
-
234
-
235
-
236
-
237
-
238
-
239
-
240
-
241
-
242
-
243
-
244
-
245
-
246
-
247
-
248
 |
 |
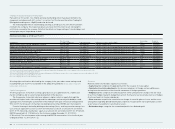
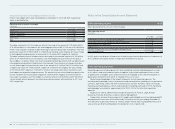
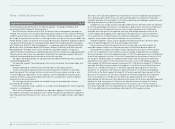
212 Consolidated Financial Statements Notes Notes to the Consolidated Statement of Financial Position
Due to the short-term maturities of cash and cash equivalents, short-term financial assets,
accounts receivable and payable as well as other current financial receivables and payables, their
respective fair values approximate their carrying amount.
The fair values of non-current financial assets and liabilities are estimated by discounting
expected future cash flows using current interest rates for debt of similar terms and remaining
maturities, and adjusted by an adidas Group specific credit risk premium.
Fair values of long-term financial assets classified as available-for-sale are based on quoted
market prices in an active market or are calculated as present values of expected future cash
flows.
The fair values of forward contracts and currency options are determined on the basis of
market conditions at the balance sheet date. The fair value of a currency option is determined
using generally accepted models to calculate option prices, such as the “Garman-Kohlhagen-
model”. The fair market value of an option is influenced not only by the remaining term of the
option, but also by other determining factors such as the actual foreign exchange rate and the
volatility of the underlying foreign currency base.
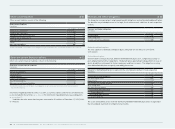
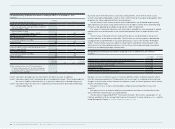
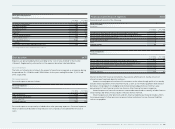
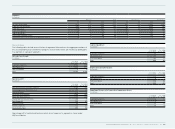
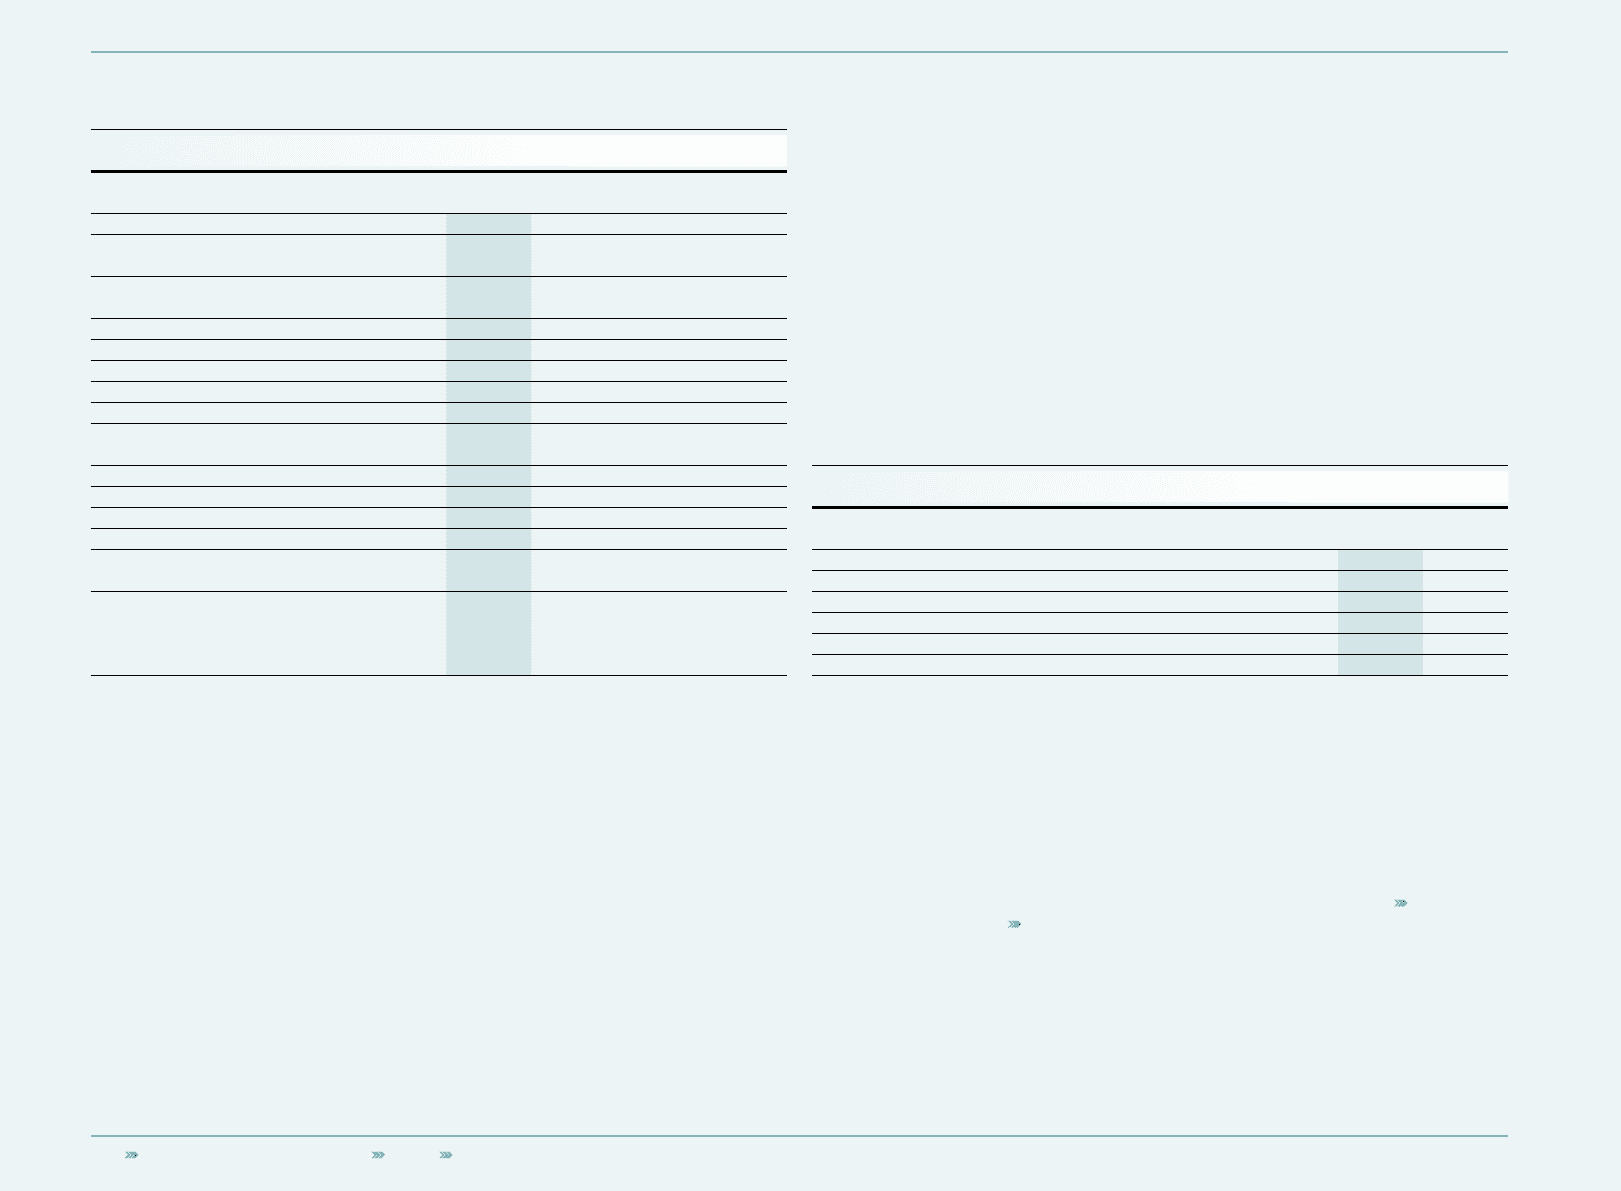
Net gains/(losses) on financial instruments recognised in the consolidated income statement
€ in millions
Year ending
Dec. 31, 2010 Year ending
Dec. 31, 2009
Financial assets or financial liabilities at fair value through profit or loss (6) 4
thereof: designated as such upon initial recognition — —
thereof: classified as held for trading (6) 4
Loans and receivables (81) (44)
Available-for-sale financial assets — —
Financial liabilities measured at amortised cost 6 5
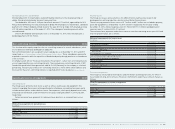
Net gains or losses on financial assets or financial liabilities held for trading include the effects
from fair value measurements of the derivatives that are not part of a hedging relationship, and
changes in the fair value of other financial instruments as well as interest payments which mainly
relate to investment funds.
Net gains or losses on loans and receivables comprise mainly impairment losses and
reversals.
Net gains or losses on financial liabilities measured at amortised cost include effects from
early settlement and reversals of accrued liabilities.
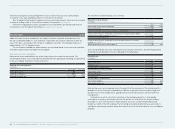
The disclosures required by IFRS 7 “Financial Instruments: Disclosures”, paragraphs 31 – 42
(“Nature and Extent of Risks arising from Financial Instruments”), can be found in Note 6 and the
Group Management Report see Risk and Opportunity Report, p. 158.
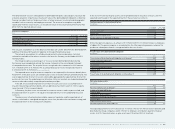
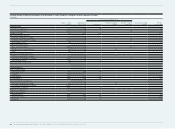
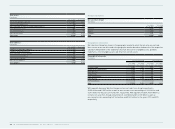
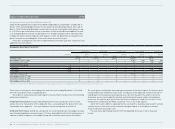
Fair value hierarchy of financial instruments according to IFRS 7 as at December 31, 2010
€ in millions
Fair value hierarchy, aggregated by category Fair value
Dec. 31, 2010 Level 1 Level 2 Level 3
Financial assets at fair value through profit or loss
thereof: designated as such upon initial recognition
(Fair Value Option – FVO) —
thereof: Held for Trading
(Financial Assets Held for Trading – FAHfT) 336 257 79 1 )
Available-for-Sale Financial Assets (AfS) 14 14
Other financial assets
Derivatives being part of a hedge 70 70
Financial assets 420 341 79
Financial Liabilities at fair value through profit or loss
Held for Trading (FLHfT) 28 28
Other financial liabilities
Derivatives being part of a hedge 80 80
Financial liabilities 108 108
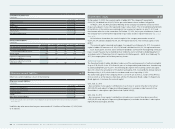
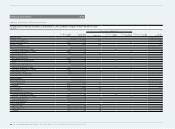
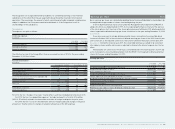
Fair value
Jan. 1, 2010 Gains Losses Fair value
Dec. 31, 2010
1) This category relates to a 9.7% investment in
FC Bayern München AG of € 79 million. Dividends
are distributed by FC Bayern München AG instead
of regular interest payments. 79 0 — 79
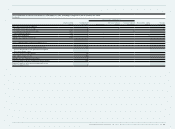
Level 1 is based on quoted prices in active markets for identical assets or liabilities.
Level 2 is based on inputs other than quoted prices included within Level 1 that are observable for
the asset or liability, either directly (i.e. as prices) or indirectly (i.e. derived from prices).
Level 3 is based on inputs for the asset or liability that are not based on observable market data
(unobservable inputs).