Reebok 2010 Annual Report Download - page 139
Download and view the complete annual report
Please find page 139 of the 2010 Reebok annual report below. You can navigate through the pages in the report by either clicking on the pages listed below, or by using the keyword search tool below to find specific information within the annual report.-
 1
1 -
2
-
3
-
4
-
5
-
6
-
7
-
8
-
9
-
10
-
11
-
12
-
13
-
14
-
15
-
16
-
17
-
18
-
19
-
20
-
21
-
22
-
23
-
24
-
25
-
26
-
27
-
28
-
29
-
30
-
31
-
32
-
33
-
34
-
35
-
36
-
37
-
38
-
39
-
40
-
41
-
42
-
43
-
44
-
45
-
46
-
47
-
48
-
49
-
50
-
51
-
52
-
53
-
54
-
55
-
56
-
57
-
58
-
59
-
60
-
61
-
62
-
63
-
64
-
65
-
66
-
67
-
68
-
69
-
70
-
71
-
72
-
73
-
74
-
75
-
76
-
77
-
78
-
79
-
80
-
81
-
82
-
83
-
84
-
85
-
86
-
87
-
88
-
89
-
90
-
91
-
92
-
93
-
94
-
95
-
96
-
97
-
98
-
99
-
100
-
101
-
102
-
103
-
104
-
105
-
106
-
107
-
108
-
109
-
110
-
111
-
112
-
113
-
114
-
115
-
116
-
117
-
118
-
119
-
120
-
121
-
122
-
123
-
124
-
125
-
126
-
127
-
128
-
 129
129 -
 130
130 -
 131
131 -
 132
132 -
 133
133 -
 134
134 -
 135
135 -
 136
136 -
 137
137 -
 138
138 -
 139
139 -
 140
140 -
 141
141 -
 142
142 -
 143
143 -
 144
144 -
 145
145 -
 146
146 -
 147
147 -
 148
148 -
 149
149 -
150
-
151
-
152
-
153
-
154
-
155
-
156
-
157
-
158
-
159
-
160
-
161
-
162
-
163
-
164
-
165
-
166
-
167
-
168
-
169
-
170
-
171
-
172
-
173
-
174
-
175
-
176
-
177
-
178
-
179
-
180
-
181
-
182
-
183
-
184
-
185
-
186
-
187
-
188
-
189
-
190
-
191
-
192
-
193
-
194
-
195
-
196
-
197
-
198
-
199
-
200
-
201
-
202
-
203
-
204
-
205
-
206
-
207
-
208
-
209
-
210
-
211
-
212
-
213
-
214
-
215
-
216
-
217
-
218
-
219
-
220
-
221
-
222
-
223
-
224
-
225
-
226
-
227
-
228
-
229
-
230
-
231
-
232
-
233
-
234
-
235
-
236
-
237
-
238
-
239
-
240
-
241
-
242
-
243
-
244
-
245
-
246
-
247
-
248
 |
 |
Group Management Report – Financial Review Group Business Performance Income Statement 135
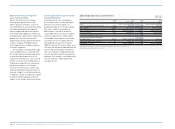
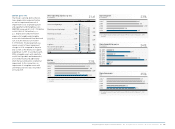
Gross margin
in %
1) Including Reebok, Rockport and Reebok-CCM Hockey from February 1, 2006
onwards.
Gross profit
€ in millions
1) Including Reebok, Rockport and Reebok-CCM Hockey from February 1, 2006
onwards.
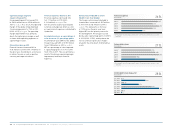
Gross margin by quarter
in %
15
14
16
2006 1 )
2007
2008
2009
2010
2006 1 )
2007
2008
2009
2010
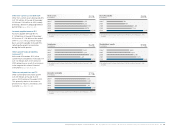
44.6
47.4
48.7
45.4
47.8
4,495
4,882
5,256
4,712
5,730
Q1 2009
Q1 2010
Q2 2009
Q2 2010
Q3 2009
Q3 2010
Q4 2009
Q4 2010
45.248.6
45.048.9
45.3
47.3
46.2
46.5
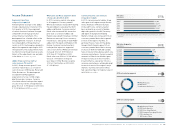
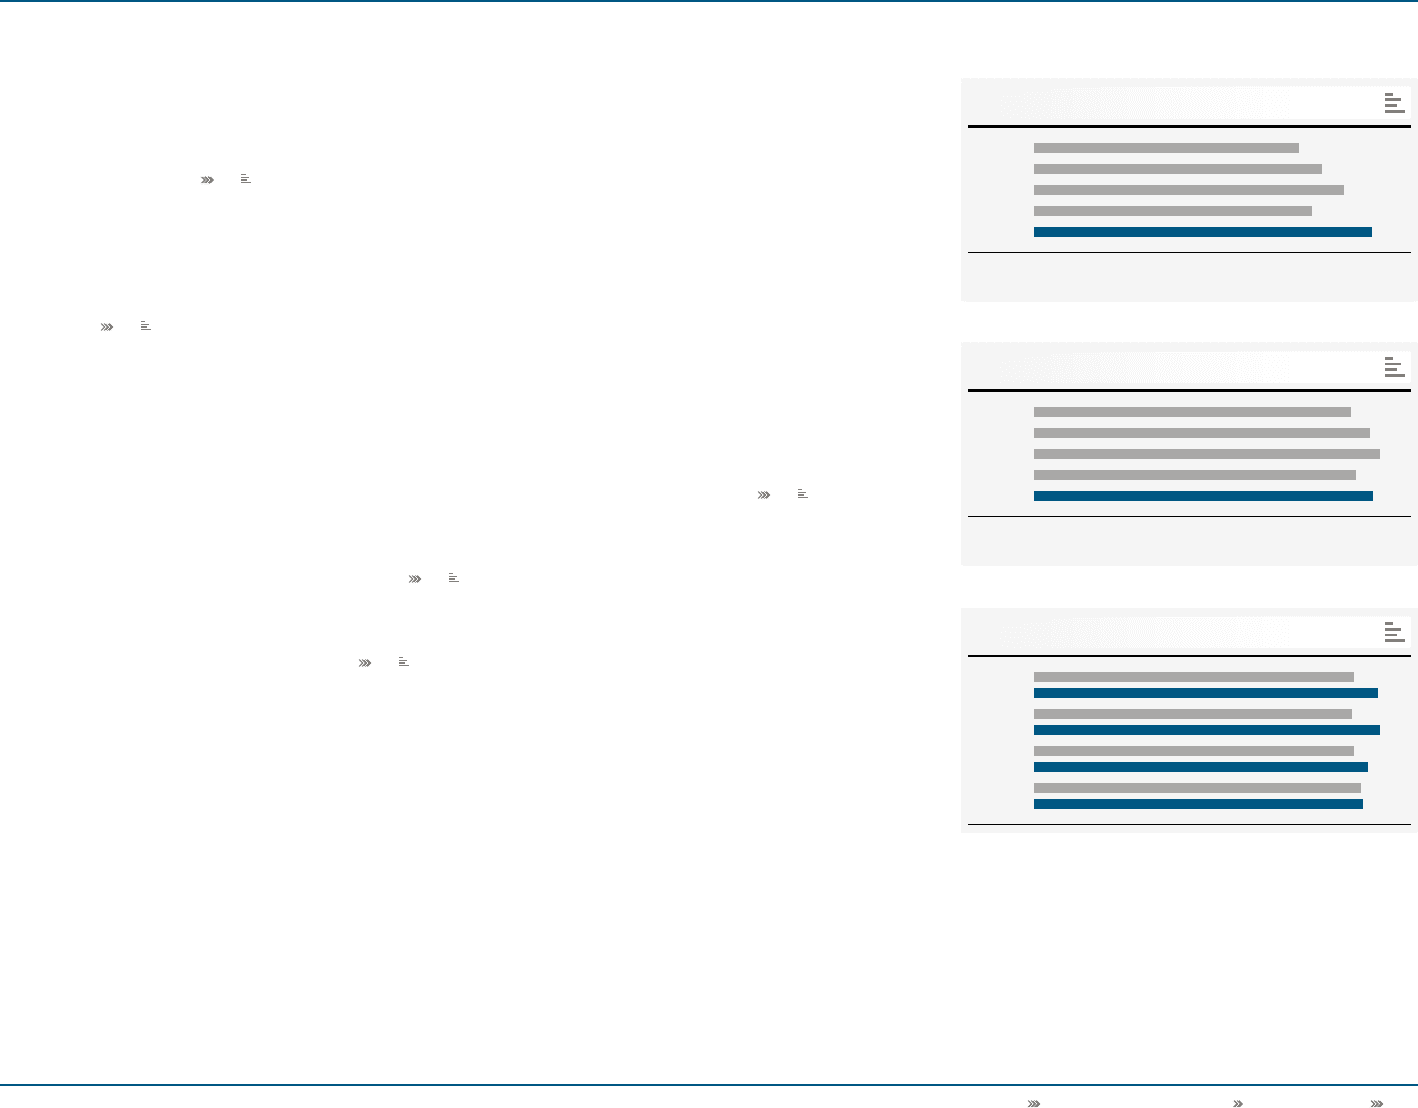
Group gross margin improves
2.4 percentage points
The gross margin of the adidas Group
increased 2.4 percentage points to
47.8% in 2010 (2009: 45.4%) see 15.
This development was mainly due to
lower input costs, less clearance sales
and a larger share of higher-margin
Retail sales. As a result, gross profit for
the adidas Group grew 22% in 2010 to
€ 5.730 billion versus € 4.712 billion in
the prior year see 14.
Royalty and commission income grows
Royalty and commission income for
the adidas Group increased 16% to
€ 100 million in 2010 from € 86 million
in the prior year. On a currency-neutral
basis, royalty and commission income
was up 12%, mainly as a result of
higher licensee sales. New licensee
partnerships also had a positive effect
on the Group’s royalty and commission
income.
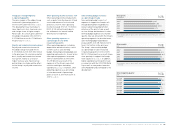
Other operating income increases 10%
Other operating income includes items
such as gains from the disposal of fixed
assets and releases of accruals and
provisions. In 2010, other operating
income increased 10% to € 110 million
(2009: € 100 million), mainly due to
the settlement of a lawsuit and the
divestiture of a trademark.
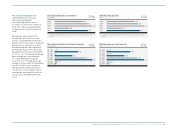
Other operating expenses as
a percentage of sales down
0.2 percentage points
Other operating expenses, including
depreciation and amortisation, consist
of items such as sales working
budget, marketing working budget and
operating overhead costs. In euro terms,
other operating expenses increased
15% to € 5.046 billion in 2010 (2009:
€ 4.390 billion), as a result of the
expansion of the Group’s own-retail
activities and higher marketing
expenditure see 17. However, other
operating expenses as a percentage
of sales decreased 0.2 percentage
points to 42.1% in 2010 from 42.3% in
2009 see 18.
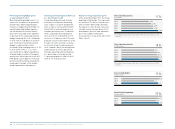
Sales working budget increases
as a percentage of sales
Sales working budget consists of
expenses to support the Group’s sell-
through development. Expenditures
relate to advertising and promotion
initiatives at the point of sale as well
as store fittings and furniture. As sales
working budget expenses are channel-
specific, they are allocated to the Group’s
operating segments. In absolute terms,
sales working budget expenditures
increased 28% to € 308 million in 2010
from € 241 million in the prior year.
The Group’s sales working budget
as a percentage of sales increased
0.3 percentage points to 2.6% in 2010
(2009: 2.3%), primarily as a result of new
store openings to support the Group’s
retail expansion see 19. In addition,
higher expenditure at the point of sale
in connection with the 2010 FIFA World
Cup as well as new product launches
at the Reebok brand contributed to this
development.