Reebok 2010 Annual Report Download - page 14
Download and view the complete annual report
Please find page 14 of the 2010 Reebok annual report below. You can navigate through the pages in the report by either clicking on the pages listed below, or by using the keyword search tool below to find specific information within the annual report.-
 1
1 -
2
-
3
-
 4
4 -
 5
5 -
 6
6 -
 7
7 -
 8
8 -
 9
9 -
 10
10 -
 11
11 -
 12
12 -
 13
13 -
 14
14 -
 15
15 -
 16
16 -
 17
17 -
 18
18 -
 19
19 -
 20
20 -
 21
21 -
 22
22 -
 23
23 -
 24
24 -
25
-
26
-
27
-
28
-
29
-
30
-
31
-
32
-
33
-
34
-
35
-
36
-
37
-
38
-
39
-
40
-
41
-
42
-
43
-
44
-
45
-
46
-
47
-
48
-
49
-
50
-
51
-
52
-
53
-
54
-
55
-
56
-
57
-
58
-
59
-
60
-
61
-
62
-
63
-
64
-
65
-
66
-
67
-
68
-
69
-
70
-
71
-
72
-
73
-
74
-
75
-
76
-
77
-
78
-
79
-
80
-
81
-
82
-
83
-
84
-
85
-
86
-
87
-
88
-
89
-
90
-
91
-
92
-
93
-
94
-
95
-
96
-
97
-
98
-
99
-
100
-
101
-
102
-
103
-
104
-
105
-
106
-
107
-
108
-
109
-
110
-
111
-
112
-
113
-
114
-
115
-
116
-
117
-
118
-
119
-
120
-
121
-
122
-
123
-
124
-
125
-
126
-
127
-
128
-
129
-
130
-
131
-
132
-
133
-
134
-
135
-
136
-
137
-
138
-
139
-
140
-
141
-
142
-
143
-
144
-
145
-
146
-
147
-
148
-
149
-
150
-
151
-
152
-
153
-
154
-
155
-
156
-
157
-
158
-
159
-
160
-
161
-
162
-
163
-
164
-
165
-
166
-
167
-
168
-
169
-
170
-
171
-
172
-
173
-
174
-
175
-
176
-
177
-
178
-
179
-
180
-
181
-
182
-
183
-
184
-
185
-
186
-
187
-
188
-
189
-
190
-
191
-
192
-
193
-
194
-
195
-
196
-
197
-
198
-
199
-
200
-
201
-
202
-
203
-
204
-
205
-
206
-
207
-
208
-
209
-
210
-
211
-
212
-
213
-
214
-
215
-
216
-
217
-
218
-
219
-
220
-
221
-
222
-
223
-
224
-
225
-
226
-
227
-
228
-
229
-
230
-
231
-
232
-
233
-
234
-
235
-
236
-
237
-
238
-
239
-
240
-
241
-
242
-
243
-
244
-
245
-
246
-
247
-
248
 |
 |

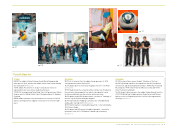
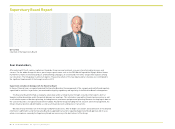
10 To Our Shareholders Interview with the CEO
Interview with the CEOInterview with the CEO
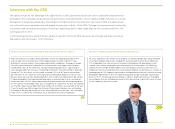
The adidas Group took full advantage of its opportunities in 2010, generating record sales and a substantial improvement in
profitability. The strong operating and financial performance facilitated another year of significant debt reduction. As a result,
Management is proposing a dividend to shareholders of € 0.80, more than twice the prior year level. In 2010, the adidas Group
also outlined its most comprehensive and aligned strategic plan to date – Route 2015. Through its premium brands, leadership
in innovation and strong financial position, the Group is expecting a mid- to high-single-digit top-line increase and 10% to 15%
earnings growth in 2011.
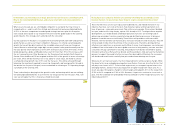
In the following interview, Herbert Hainer, adidas Group CEO, reflects on 2010, discusses the strategic and financial outlook,
and explains why the Group is “fit for the future”.
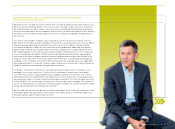
After the financial crisis and economic difficulties of 2009, we rebounded strongly in 2010
and can reflect on an excellent year. The Group generated a record € 12 billion in sales,
growing 9% currency-neutral, clearly outpacing our major competitors. Group gross margin
was up 2.4 percentage points, driven by less clearance sales and a larger share of higher-
margin Retail sales. At the same time, we reduced operating expenses as a percentage of
sales, despite significant increases in marketing investments. This led to a jump in operating
margin to 7.5%. As a result, our net income increased 131% to € 567 million and earnings
per share were € 2.71, which was at the top end of our November guidance. In terms of our
balance sheet and cash flow, the development in 2010 could not have been better. We shaved
3.5 percentage points from operating working capital as a percentage of sales, reaching our
lowest ever level of 20.8%. And our operating cash flow generation, the most important driver
for the creation of shareholder value, was an exceptional € 1.2 billion for the year. This allowed
us to further reduce our net debt, which now stands at € 221 million, just one tenth of the level
it was 24 months ago. Without question, this year’s financial performance is an outstanding
achievement. Not only did we meet all of our initial expectations for the year – we clearly beat
them. This is a credit to the commitment, focus and hard work of all our employees.
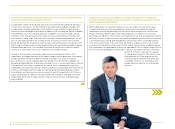
All of our segments hit the mark in 2010. However, an obvious highlight was the performance
of our Retail segment where sales climbed 18% currency-neutral, driven by an impressive
11% comparable store sales increase. Particularly satisfying was the development of our
concept stores, where comparable store sales growth was an even higher 14%. While this
underscores the strength and desirability of our 2010 product collections, even more so it
emphasises that the strategic direction we are taking to improve our proficiency as a retailer is
already paying off. This segment’s performance contributed more than half of the entire Group
profitability improvement in 2010, as segmental operating margin increased 5.3 percentage
points to 18.9%. The leverage we have in Retail is obvious. And this performance should give
you confidence that our continued investment in this space will be a significant source of value
for our company in the years to come.
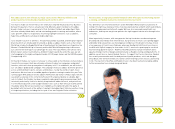
Herbert, how has the Group performed in 2010, and have you met your targets?Herbert, how has the Group performed in 2010, and have you met your targets? Was there a segment that particularly drove this performance?Was there a segment that particularly drove this performance?