Reebok 2010 Annual Report Download - page 132
Download and view the complete annual report
Please find page 132 of the 2010 Reebok annual report below. You can navigate through the pages in the report by either clicking on the pages listed below, or by using the keyword search tool below to find specific information within the annual report.-
 1
1 -
 2
2 -
 3
3 -
 4
4 -
 5
5 -
 6
6 -
 7
7 -
 8
8 -
 9
9 -
 10
10 -
 11
11 -
 12
12 -
 13
13 -
 14
14 -
 15
15 -
 16
16 -
 17
17 -
 18
18 -
 19
19 -
 20
20 -
 21
21 -
 22
22 -
 23
23 -
 24
24 -
 25
25 -
 26
26 -
 27
27 -
 28
28 -
 29
29 -
 30
30 -
 31
31 -
 32
32 -
 33
33 -
 34
34 -
 35
35 -
 36
36 -
 37
37 -
 38
38 -
 39
39 -
 40
40 -
 41
41 -
 42
42 -
 43
43 -
 44
44 -
 45
45 -
 46
46 -
 47
47 -
 48
48 -
 49
49 -
 50
50 -
 51
51 -
 52
52 -
 53
53 -
 54
54 -
 55
55 -
 56
56 -
 57
57 -
 58
58 -
 59
59 -
 60
60 -
 61
61 -
 62
62 -
 63
63 -
 64
64 -
 65
65 -
 66
66 -
 67
67 -
 68
68 -
 69
69 -
 70
70 -
 71
71 -
 72
72 -
 73
73 -
 74
74 -
 75
75 -
 76
76 -
 77
77 -
 78
78 -
 79
79 -
 80
80 -
 81
81 -
 82
82 -
 83
83 -
 84
84 -
 85
85 -
 86
86 -
 87
87 -
 88
88 -
 89
89 -
 90
90 -
 91
91 -
 92
92 -
 93
93 -
 94
94 -
 95
95 -
 96
96 -
 97
97 -
 98
98 -
 99
99 -
 100
100 -
 101
101 -
 102
102 -
 103
103 -
 104
104 -
 105
105 -
 106
106 -
 107
107 -
 108
108 -
 109
109 -
 110
110 -
 111
111 -
 112
112 -
 113
113 -
 114
114 -
 115
115 -
 116
116 -
 117
117 -
 118
118 -
 119
119 -
 120
120 -
 121
121 -
 122
122 -
 123
123 -
 124
124 -
 125
125 -
 126
126 -
 127
127 -
 128
128 -
 129
129 -
 130
130 -
 131
131 -
 132
132 -
 133
133 -
 134
134 -
 135
135 -
 136
136 -
 137
137 -
 138
138 -
 139
139 -
 140
140 -
 141
141 -
 142
142 -
 143
143 -
 144
144 -
 145
145 -
 146
146 -
 147
147 -
 148
148 -
 149
149 -
 150
150 -
 151
151 -
 152
152 -
 153
153 -
 154
154 -
 155
155 -
 156
156 -
 157
157 -
 158
158 -
 159
159 -
 160
160 -
 161
161 -
 162
162 -
 163
163 -
 164
164 -
 165
165 -
 166
166 -
 167
167 -
 168
168 -
 169
169 -
 170
170 -
 171
171 -
 172
172 -
 173
173 -
 174
174 -
 175
175 -
 176
176 -
 177
177 -
 178
178 -
 179
179 -
 180
180 -
 181
181 -
 182
182 -
 183
183 -
 184
184 -
 185
185 -
 186
186 -
 187
187 -
 188
188 -
 189
189 -
 190
190 -
 191
191 -
 192
192 -
 193
193 -
 194
194 -
 195
195 -
 196
196 -
 197
197 -
 198
198 -
 199
199 -
 200
200 -
 201
201 -
 202
202 -
 203
203 -
 204
204 -
 205
205 -
 206
206 -
 207
207 -
 208
208 -
 209
209 -
 210
210 -
 211
211 -
 212
212 -
 213
213 -
 214
214 -
 215
215 -
 216
216 -
 217
217 -
 218
218 -
 219
219 -
 220
220 -
 221
221 -
 222
222 -
 223
223 -
 224
224 -
 225
225 -
 226
226 -
 227
227 -
 228
228 -
 229
229 -
 230
230 -
 231
231 -
 232
232 -
 233
233 -
 234
234 -
 235
235 -
 236
236 -
 237
237 -
 238
238 -
 239
239 -
 240
240 -
 241
241 -
 242
242 -
 243
243 -
 244
244 -
 245
245 -
 246
246 -
 247
247 -
 248
248
 |
 |

128 Group Management Report – Financial Review Internal Group Management System
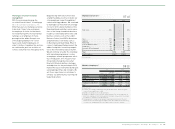
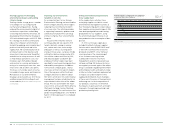
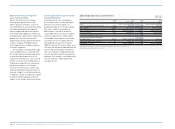
adidas Group targets versus actual key metrics
2009
Actual 2010
Initial outlook 1 )
2010
Actual 2011
Targets
Sales
(year-over-year change, currency-neutral) (6%) low- to mid-single-digit
increase 9% mid- to high-single-digit
increase
Gross margin 45.4% 46% to 47% 47.8% 47.5% to 48.0%
Other operating expenses (in % of sales) 42.3% moderate decline 42.1% moderate decline
Operating margin 4.9% around 6.5% 7.5% 7.5% to 8.0%
(Diluted) earnings per share (in €) 1.22 1.90 to 2.15 2.71 2.98 to 3.12
Average operating working capital
(in % of net sales) 24.3% further reduction 20.8% increase
Capital expenditure (€ in millions) 2 ) 240 300 to 400 269 350 to 400
Net debt (€ in millions) 917 further reduction 221 further reduction
1) As published on March 3, 2010. The outlook was updated over the course of the year.
2) Excluding acquisitions and finance leases.
03
M&A activities focus on long-term
value creation potential
We see the majority of our Group’s
future growth opportunities in our
organic business. However, as part of
our commitment to ensuring sustainable
profitable development we regularly
review merger and acquisition options
that may provide additional commercial
and operational opportunities. Acquisitive
growth focus is primarily related to
improving our Group’s positioning within
a sports category, strengthening our
technology portfolio or addressing new
consumer segments.
The strategies of any potential acqui-
sition candidate must correspond with
the Group’s direction. Maximising return
on invested capital above the cost of
capital in the long term is a core consid-
eration in our decision-making process.
Of particular importance is evaluating
the potential impact on our Group’s
free cash flow. We assess current and
future projected key financial metrics to
evaluate a target’s contribution potential.
In addition, careful consideration is given
to potential financing needs and their
impact on the Group’s financial leverage.
Cost of capital metric used to measure
investment potential
Creating value for our shareholders
by earning a return on invested capital
above the cost of that capital is a
guiding principle of our Group strategy.
We source capital from equity and
debt markets. Therefore, we have a
responsibility that our return on capital
meets the expectations of both equity
shareholders and creditors. Our Group
calculates the cost of capital utilising
the weighted average cost of capital
(WACC) formula. This metric allows us to
calculate the minimum required financial
returns of planned capital investments.
The cost of equity is computed utilising
the risk-free rate, market risk premium
and beta. Cost of debt is calculated using
the risk-free rate, credit spread and
average tax rate.
