Reebok 2010 Annual Report Download - page 228
Download and view the complete annual report
Please find page 228 of the 2010 Reebok annual report below. You can navigate through the pages in the report by either clicking on the pages listed below, or by using the keyword search tool below to find specific information within the annual report.-
 1
1 -
2
-
3
-
4
-
5
-
6
-
7
-
8
-
9
-
10
-
11
-
12
-
13
-
14
-
15
-
16
-
17
-
18
-
19
-
20
-
21
-
22
-
23
-
24
-
25
-
26
-
27
-
28
-
29
-
30
-
31
-
32
-
33
-
34
-
35
-
36
-
37
-
38
-
39
-
40
-
41
-
42
-
43
-
44
-
45
-
46
-
47
-
48
-
49
-
50
-
51
-
52
-
53
-
54
-
55
-
56
-
57
-
58
-
59
-
60
-
61
-
62
-
63
-
64
-
65
-
66
-
67
-
68
-
69
-
70
-
71
-
72
-
73
-
74
-
75
-
76
-
77
-
78
-
79
-
80
-
81
-
82
-
83
-
84
-
85
-
86
-
87
-
88
-
89
-
90
-
91
-
92
-
93
-
94
-
95
-
96
-
97
-
98
-
99
-
100
-
101
-
102
-
103
-
104
-
105
-
106
-
107
-
108
-
109
-
110
-
111
-
112
-
113
-
114
-
115
-
116
-
117
-
118
-
119
-
120
-
121
-
122
-
123
-
124
-
125
-
126
-
127
-
128
-
129
-
130
-
131
-
132
-
133
-
134
-
135
-
136
-
137
-
138
-
139
-
140
-
141
-
142
-
143
-
144
-
145
-
146
-
147
-
148
-
149
-
150
-
151
-
152
-
153
-
154
-
155
-
156
-
157
-
158
-
159
-
160
-
161
-
162
-
163
-
164
-
165
-
166
-
167
-
168
-
169
-
170
-
171
-
172
-
173
-
174
-
175
-
176
-
177
-
178
-
179
-
180
-
181
-
182
-
183
-
184
-
185
-
186
-
187
-
188
-
189
-
190
-
191
-
192
-
193
-
194
-
195
-
196
-
197
-
198
-
199
-
200
-
201
-
202
-
203
-
204
-
205
-
206
-
207
-
208
-
209
-
210
-
211
-
212
-
213
-
214
-
215
-
216
-
217
-
 218
218 -
 219
219 -
 220
220 -
 221
221 -
 222
222 -
 223
223 -
 224
224 -
 225
225 -
 226
226 -
 227
227 -
 228
228 -
 229
229 -
 230
230 -
 231
231 -
 232
232 -
 233
233 -
 234
234 -
 235
235 -
 236
236 -
 237
237 -
 238
238 -
239
-
240
-
241
-
242
-
243
-
244
-
245
-
246
-
247
-
248
 |
 |
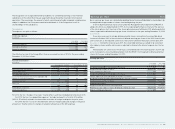
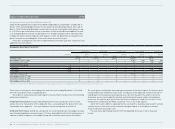
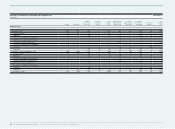
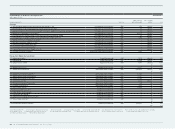
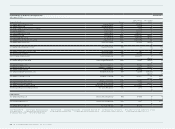
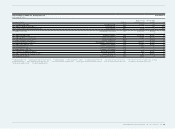
224 Consolidated Financial Statements Statement of Movements of Intangible and Tangible Assets
Statement of Movements of Intangible and Tangible Assets Attachment I
€ in millions
Goodwill Trademarks
Software,
patents and
concessions
Internally
generated
software
Total
intangible
assets
Land and build-
ings/leasehold
improvements
Technical
equipment and
machinery
Other equip-
ment, furniture
and fittings Construction
in progress
Total
tangible
assets
Acquisition cost
January 1, 2009 1,499 1,390 516 1 3,406 489 140 847 66 1,542
Currency effect (26) (48) (7) — (81) (7) (1) (3) (1) (13)
Additions 1 0 48 0 50 17 4 101 72 195
Increase in companies consolidated 4 — 0 — 4 — 0 6 — 6
Transfers from assets held for sale — — — — — 4 2 1 — 7
Transfers to assets held for sale — — — — — (126) — — — (126)
Decrease in companies consolidated 0 — — — 0 — — — — —
Transfers — — 2 1 3 28 28 6 (65) (3)
Disposals — — (24) (0) (25) (25) (19) (82) (2) (128)
December 31, 2009 /January 1, 2010 1,478 1,342 535 3 3,358 380 156 876 69 1,480
Currency effect 61 105 28 — 194 18 12 75 1 106
Additions 0 — 41 0 42 20 5 103 100 227
Increase in companies consolidated — — — — — — — — — —
Transfers from assets held for sale — — — — — 95 — — — 95
Transfers to assets held for sale — — (1) — (1) (2) — (4) — (6)
Decrease in companies consolidated — — — — — — — — — —
Transfers — — (2) 2 0 6 4 18 (28) (0)
Disposals — (0) (5) (0) (6) (6) (16) (82) (2) (105)
December 31, 2010 1,539 1,447 595 5 3,586 511 161 987 140 1,798