Reebok 2010 Annual Report Download - page 154
Download and view the complete annual report
Please find page 154 of the 2010 Reebok annual report below. You can navigate through the pages in the report by either clicking on the pages listed below, or by using the keyword search tool below to find specific information within the annual report.-
 1
1 -
2
-
3
-
4
-
5
-
6
-
7
-
8
-
9
-
10
-
11
-
12
-
13
-
14
-
15
-
16
-
17
-
18
-
19
-
20
-
21
-
22
-
23
-
24
-
25
-
26
-
27
-
28
-
29
-
30
-
31
-
32
-
33
-
34
-
35
-
36
-
37
-
38
-
39
-
40
-
41
-
42
-
43
-
44
-
45
-
46
-
47
-
48
-
49
-
50
-
51
-
52
-
53
-
54
-
55
-
56
-
57
-
58
-
59
-
60
-
61
-
62
-
63
-
64
-
65
-
66
-
67
-
68
-
69
-
70
-
71
-
72
-
73
-
74
-
75
-
76
-
77
-
78
-
79
-
80
-
81
-
82
-
83
-
84
-
85
-
86
-
87
-
88
-
89
-
90
-
91
-
92
-
93
-
94
-
95
-
96
-
97
-
98
-
99
-
100
-
101
-
102
-
103
-
104
-
105
-
106
-
107
-
108
-
109
-
110
-
111
-
112
-
113
-
114
-
115
-
116
-
117
-
118
-
119
-
120
-
121
-
122
-
123
-
124
-
125
-
126
-
127
-
128
-
129
-
130
-
131
-
132
-
133
-
134
-
135
-
136
-
137
-
138
-
139
-
140
-
141
-
142
-
143
-
 144
144 -
 145
145 -
 146
146 -
 147
147 -
 148
148 -
 149
149 -
 150
150 -
 151
151 -
 152
152 -
 153
153 -
 154
154 -
 155
155 -
 156
156 -
 157
157 -
 158
158 -
 159
159 -
 160
160 -
 161
161 -
 162
162 -
 163
163 -
 164
164 -
165
-
166
-
167
-
168
-
169
-
170
-
171
-
172
-
173
-
174
-
175
-
176
-
177
-
178
-
179
-
180
-
181
-
182
-
183
-
184
-
185
-
186
-
187
-
188
-
189
-
190
-
191
-
192
-
193
-
194
-
195
-
196
-
197
-
198
-
199
-
200
-
201
-
202
-
203
-
204
-
205
-
206
-
207
-
208
-
209
-
210
-
211
-
212
-
213
-
214
-
215
-
216
-
217
-
218
-
219
-
220
-
221
-
222
-
223
-
224
-
225
-
226
-
227
-
228
-
229
-
230
-
231
-
232
-
233
-
234
-
235
-
236
-
237
-
238
-
239
-
240
-
241
-
242
-
243
-
244
-
245
-
246
-
247
-
248
 |
 |
150 Group Management Report – Financial Review Business Performance by Segment Wholesale Business Performance
Business Performance by Segment
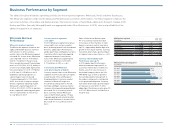
The adidas Group has divided its operating activities into three reported segments: Wholesale, Retail and Other Businesses.
The Wholesale segment comprises the adidas and Reebok business activities with retailers. The Retail segment comprises the
own-retail activities of the adidas and Reebok brands. The financial results of TaylorMade-adidas Golf, Rockport, Reebok-CCM
Hockey and Other Centrally Managed Brands are aggregated under Other Businesses. In 2010, sales and profitability of the
adidas Group grew in all segments.
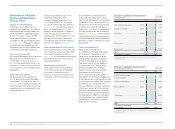
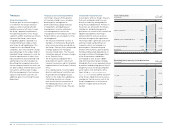
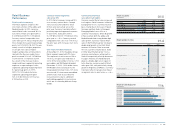
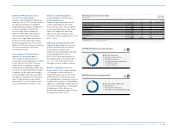
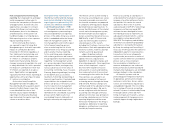
Wholesale at a glance
€ in millions
2010 2009 Change
Net sales 8,181 7,164 14%
Gross profit 3,379 2,978 13%
Gross margin 41.3% 41.6% (0.3pp)
Segmental operating profit 2,572 2,342 10%
Segmental operating margin 31.4% 32.7% (1.2pp)
01
Wholesale Business
Performance
Wholesale results in summary
The Wholesale segment comprises the
adidas and Reebok business activities
with retailers. In 2010, currency-
neutral sales in the Wholesale segment
increased 8%. In euro terms, Wholesale
sales improved 14% to € 8.181 billion
from € 7.164 billion in the prior year.
Gross margin decreased 0.3 percentage
points to 41.3% (2009: 41.6%), mainly as
a result of an unfavourable regional mix.
Gross profit grew 13% to € 3.379 billion
in 2010 from € 2.978 billion in 2009.
Segmental operating expenses as
a percentage of sales increased
1.0 percentage points to 9.9% (2009:
8.9%). As a result of the gross margin
decline, segmental operating margin
decreased 1.2 percentage points to
31.4% in 2010 (2009: 32.7%). In absolute
terms, segmental operating profit grew
10% to € 2.572 billion in 2010 versus
€ 2.342 billion in 2009.
Currency-neutral segmental
sales up 8%
In 2010, Wholesale segmental revenues
increased 8% on a currency-neutral
basis, driven by growth in all three brand
divisions: adidas Sport Performance,
adidas Sport Style and Reebok. Currency
translation effects positively impacted
segmental revenues in euro terms.
Sales in the Wholesale segment grew
14% to € 8.181 billion in 2010 from
€ 7.164 billion in 2009 see 01.
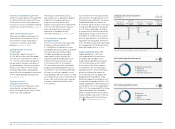
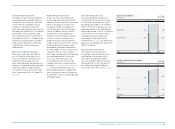
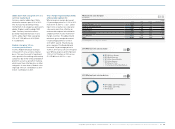
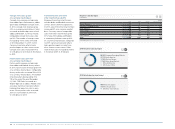
Currency-neutral Wholesale
sales grow in nearly all regions
Currency-neutral sales for the Wholesale
segment in 2010 increased in all regions
except Greater China and European
Emerging Markets. Currency-neutral
revenues in Western Europe rose
8%, driven by sales growth in the UK,
Germany and Spain. Currency-neutral
revenues in European Emerging Markets
decreased 2% on a currency-neutral
basis. Currency-neutral Wholesale
sales in North America grew 17% due
to double-digit growth in both the USA
and Canada. Revenues in Greater China
decreased 7% on a currency-neutral
basis.
Sales in Other Asian Markets grew
8% on a currency-neutral basis due
to increases in most markets. In Latin
America, currency-neutral sales were
up 11%, supported by double-digit sales
growth in most major markets. Currency
translation effects had a positive impact
on regional sales in euro terms see 03.
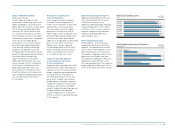
Currency-neutral adidas Sport
Performance sales up 2%
In 2010, adidas Sport Performance
wholesale revenues improved 2% on
a currency-neutral basis. Growth was
mainly a result of sales increases in
the football category, due to the 2010
FIFA World Cup, as well as growth in
the running category. Sales growth in
the outdoor category also contributed
to this positive development. Currency
translation effects had a positive impact
on revenues in euro terms. In 2010,
adidas Sport Performance sales grew 9%
to € 5.101 billion from € 4.696 billion in
the prior year.
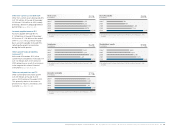
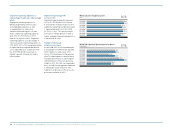
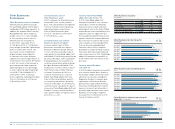
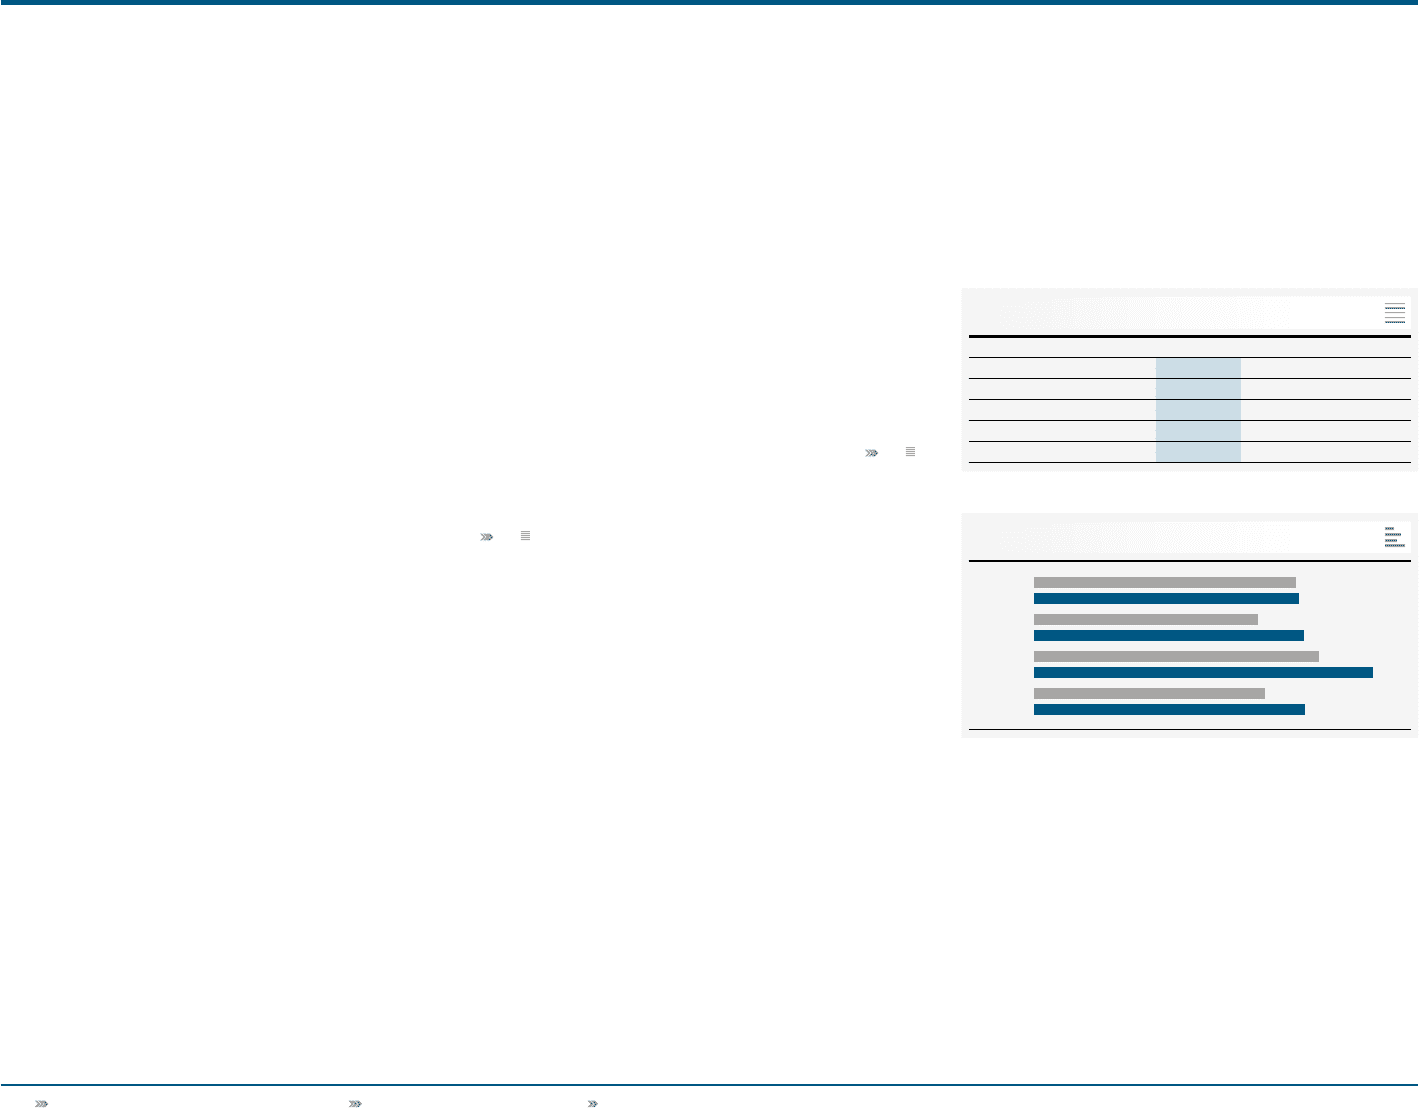
Wholesale net sales by quarter
€ in millions 02
Q1 2009
Q1 2010
Q2 2009
Q2 2010
Q3 2009
Q3 2010
Q4 2009
Q4 2010
1,874
1,898
1,605 1,928
2,036 2,421
1,648 1,934