Reebok 2010 Annual Report Download - page 173
Download and view the complete annual report
Please find page 173 of the 2010 Reebok annual report below. You can navigate through the pages in the report by either clicking on the pages listed below, or by using the keyword search tool below to find specific information within the annual report.-
 1
1 -
2
-
3
-
4
-
5
-
6
-
7
-
8
-
9
-
10
-
11
-
12
-
13
-
14
-
15
-
16
-
17
-
18
-
19
-
20
-
21
-
22
-
23
-
24
-
25
-
26
-
27
-
28
-
29
-
30
-
31
-
32
-
33
-
34
-
35
-
36
-
37
-
38
-
39
-
40
-
41
-
42
-
43
-
44
-
45
-
46
-
47
-
48
-
49
-
50
-
51
-
52
-
53
-
54
-
55
-
56
-
57
-
58
-
59
-
60
-
61
-
62
-
63
-
64
-
65
-
66
-
67
-
68
-
69
-
70
-
71
-
72
-
73
-
74
-
75
-
76
-
77
-
78
-
79
-
80
-
81
-
82
-
83
-
84
-
85
-
86
-
87
-
88
-
89
-
90
-
91
-
92
-
93
-
94
-
95
-
96
-
97
-
98
-
99
-
100
-
101
-
102
-
103
-
104
-
105
-
106
-
107
-
108
-
109
-
110
-
111
-
112
-
113
-
114
-
115
-
116
-
117
-
118
-
119
-
120
-
121
-
122
-
123
-
124
-
125
-
126
-
127
-
128
-
129
-
130
-
131
-
132
-
133
-
134
-
135
-
136
-
137
-
138
-
139
-
140
-
141
-
142
-
143
-
144
-
145
-
146
-
147
-
148
-
149
-
150
-
151
-
152
-
153
-
154
-
155
-
156
-
157
-
158
-
159
-
160
-
161
-
162
-
 163
163 -
 164
164 -
 165
165 -
 166
166 -
 167
167 -
 168
168 -
 169
169 -
 170
170 -
 171
171 -
 172
172 -
 173
173 -
 174
174 -
 175
175 -
 176
176 -
 177
177 -
 178
178 -
 179
179 -
 180
180 -
 181
181 -
 182
182 -
 183
183 -
184
-
185
-
186
-
187
-
188
-
189
-
190
-
191
-
192
-
193
-
194
-
195
-
196
-
197
-
198
-
199
-
200
-
201
-
202
-
203
-
204
-
205
-
206
-
207
-
208
-
209
-
210
-
211
-
212
-
213
-
214
-
215
-
216
-
217
-
218
-
219
-
220
-
221
-
222
-
223
-
224
-
225
-
226
-
227
-
228
-
229
-
230
-
231
-
232
-
233
-
234
-
235
-
236
-
237
-
238
-
239
-
240
-
241
-
242
-
243
-
244
-
245
-
246
-
247
-
248
 |
 |
Group Management Report – Financial Review Risk and Opportunity Report 169
Nevertheless, our net US dollar cash flow
exposure after natural hedges calculated
for 2011 was roughly € 3.3 billion at
year-end 2010, which we hedged using
forward contracts, currency options and
currency swaps see 05. Our Group’s
Treasury Policy allows us to utilise
hedging instruments, such as currency
options or option combinations, which
provide protection while – at the same
time – retaining the potential to benefit
from future favourable exchange rate
developments in the financial markets.
As 2011 hedging has almost been
completed, it is clear that conversion
rates on major currencies will be slightly
less favourable compared to those of
2010. Volume forecast variances, greater
currency volatility and an increasing
portion of our business in emerging
markets will expose the adidas Group
to additional currency risks in 2011.
Furthermore, translation impacts from
the conversion of non-euro-denominated
results into our Group’s functional
currency, the euro, might lead to a
material negative impact on our Group’s
financial performance. As a consequence,
the assessment of currency risks has
increased. We now believe the likelihood
of currency risks is highly probable and
we regard the possible financial impact of
currency risks as major.
Interest rate risks
Changes in global market interest rates
affect future interest payments for
variable-interest liabilities. As a result,
significant interest rate increases can
have an adverse effect on the Group’s
profitability, liquidity and financial
position.
In line with IFRS 7 requirements, we
have analysed the impact of changes
in the Group’s most important interest
rates on net income and shareholders’
equity. The effect of interest rate changes
on future cash flows is excluded from
this analysis. Nevertheless, accrued
interest, which is recognised as a liability,
has been re-calculated based on the
hypothetical market interest rates as
at December 31, 2010. Fair values for
derivative interest rate instruments
accounted for as cash flow hedges
were then re-evaluated based on the
hypothetical market interest rates with
the resulting effects on net income and
equity included in the sensitivity analysis.
The fair value interest rate risk from
private placements that are hedged with
fair value hedges was also taken into
consideration.
However, the effect on the income
statement from changes in the fair values
of hedged items and hedging instruments
attributable to interest rate changes
was not material. Exclusions from this
analysis are as follows:
− Some fixed-rate financial instruments,
such as certificates of deposit, which
our Group values at “fair value through
profit or loss” due to the short-term
maturity of these instruments. Potential
effects due to changes in interest rates
are considered immaterial and are not
recognised in the sensitivity analysis.
− Other fixed-rate financial instruments
are measured at amortised cost. Since
a change in interest rates would not
change the carrying amount of this
category of instruments, there is no net
income impact and they are excluded
from this analysis.
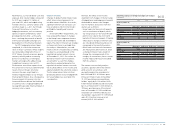
The interest rate sensitivity analysis
assumes a parallel shift of the interest
yield curve for all currencies and
was performed on the same basis for
both 2009 and 2010. A 100 basis point
increase in interest rates at December
31, 2010 would have increased share-
holders’ equity by € 0.04 million (2009:
€ 0.50 million) and decreased net income
by € 0.22 million (2009: € 0.65 million). A
100 basis point decrease of the interest
rates at December 31, 2010 would have
resulted in a € 0.04 million decrease in
shareholders’ equity (2009: € 0.05 million)
and a € 0.22 million increase in net
income (2009: € 0.63 million).
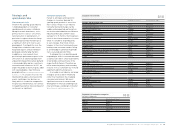
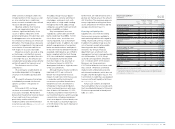
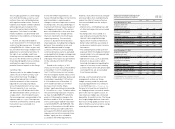
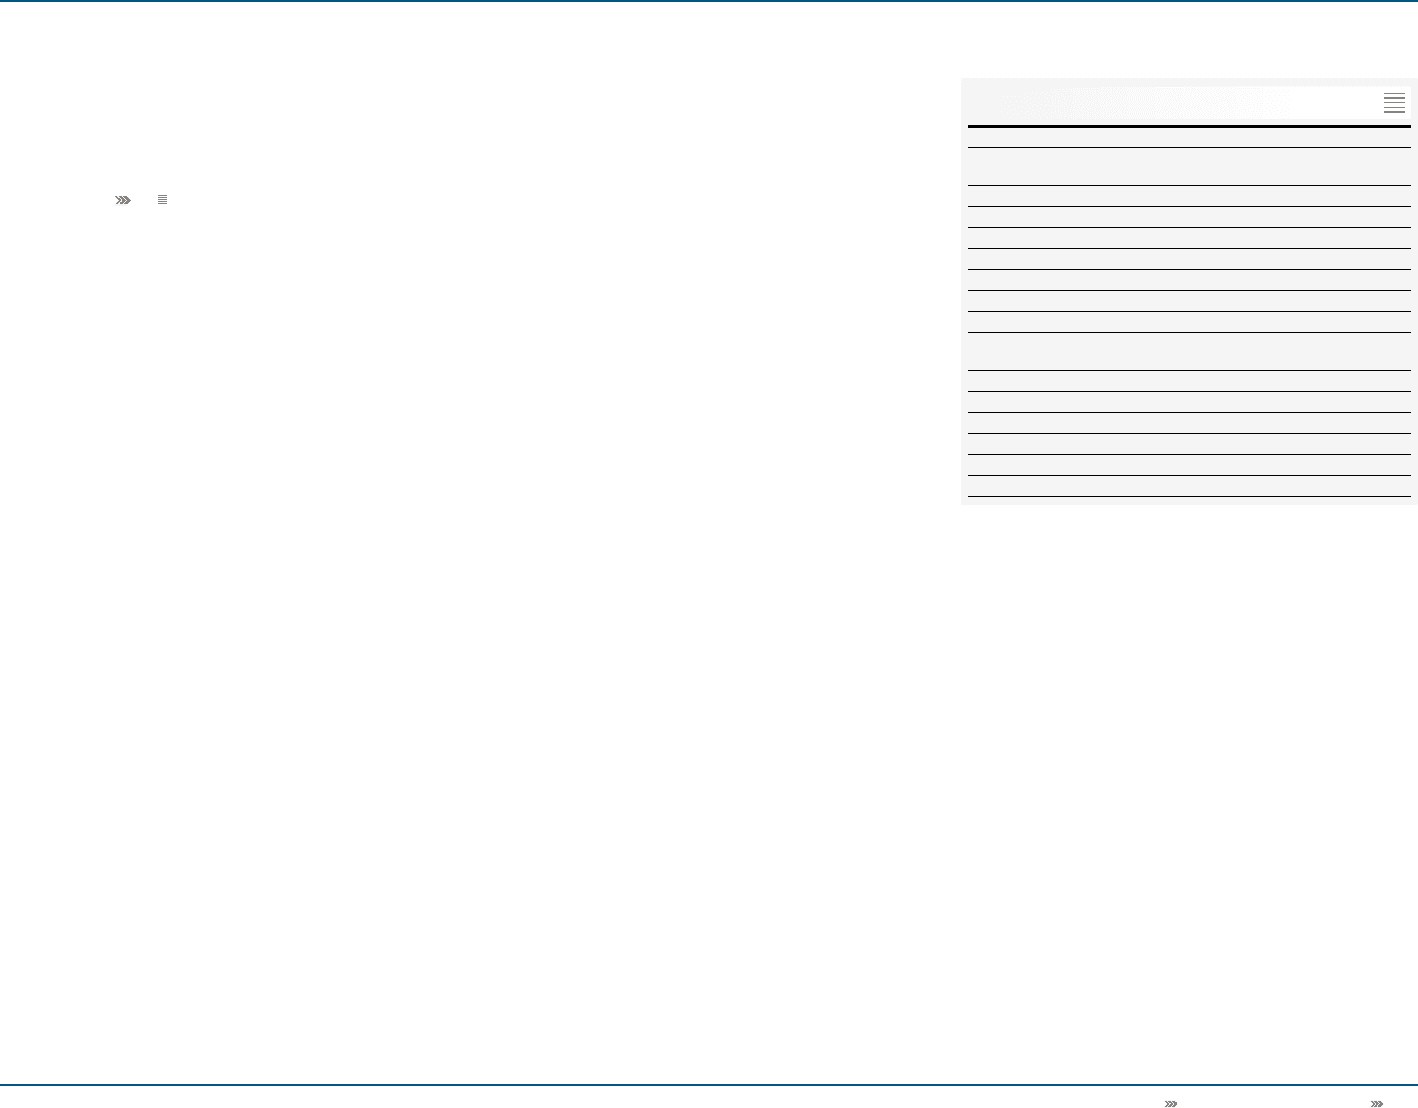
Sensitivity analysis of foreign exchange rate changes
€ in millions
USD RUB GBP JPY
As at December 31,
2010
EUR +10% USD +10% EUR +10% EUR +10%
Equity (157) — 21 20
Net income 3 (1) 1 (3)
EUR –10% USD –10% EUR –10% EUR –10%
Equity 193 — (25) (24)
Net income (4) 1 (1) 4
As at December 31,
2009
EUR +10% USD +10% EUR +10% USD +10%
Equity (144) — 21 13
Net income 1 0 (1) 0
EUR –10% USD –10% EUR –10% USD –10%
Equity 176 — (25) (13)
Net income (1) 0 1 (1)
06