Reebok 2010 Annual Report Download - page 223
Download and view the complete annual report
Please find page 223 of the 2010 Reebok annual report below. You can navigate through the pages in the report by either clicking on the pages listed below, or by using the keyword search tool below to find specific information within the annual report.-
 1
1 -
2
-
3
-
4
-
5
-
6
-
7
-
8
-
9
-
10
-
11
-
12
-
13
-
14
-
15
-
16
-
17
-
18
-
19
-
20
-
21
-
22
-
23
-
24
-
25
-
26
-
27
-
28
-
29
-
30
-
31
-
32
-
33
-
34
-
35
-
36
-
37
-
38
-
39
-
40
-
41
-
42
-
43
-
44
-
45
-
46
-
47
-
48
-
49
-
50
-
51
-
52
-
53
-
54
-
55
-
56
-
57
-
58
-
59
-
60
-
61
-
62
-
63
-
64
-
65
-
66
-
67
-
68
-
69
-
70
-
71
-
72
-
73
-
74
-
75
-
76
-
77
-
78
-
79
-
80
-
81
-
82
-
83
-
84
-
85
-
86
-
87
-
88
-
89
-
90
-
91
-
92
-
93
-
94
-
95
-
96
-
97
-
98
-
99
-
100
-
101
-
102
-
103
-
104
-
105
-
106
-
107
-
108
-
109
-
110
-
111
-
112
-
113
-
114
-
115
-
116
-
117
-
118
-
119
-
120
-
121
-
122
-
123
-
124
-
125
-
126
-
127
-
128
-
129
-
130
-
131
-
132
-
133
-
134
-
135
-
136
-
137
-
138
-
139
-
140
-
141
-
142
-
143
-
144
-
145
-
146
-
147
-
148
-
149
-
150
-
151
-
152
-
153
-
154
-
155
-
156
-
157
-
158
-
159
-
160
-
161
-
162
-
163
-
164
-
165
-
166
-
167
-
168
-
169
-
170
-
171
-
172
-
173
-
174
-
175
-
176
-
177
-
178
-
179
-
180
-
181
-
182
-
183
-
184
-
185
-
186
-
187
-
188
-
189
-
190
-
191
-
192
-
193
-
194
-
195
-
196
-
197
-
198
-
199
-
200
-
201
-
202
-
203
-
204
-
205
-
206
-
207
-
208
-
209
-
210
-
211
-
212
-
 213
213 -
 214
214 -
 215
215 -
 216
216 -
 217
217 -
 218
218 -
 219
219 -
 220
220 -
 221
221 -
 222
222 -
 223
223 -
 224
224 -
 225
225 -
 226
226 -
 227
227 -
 228
228 -
 229
229 -
 230
230 -
 231
231 -
 232
232 -
 233
233 -
234
-
235
-
236
-
237
-
238
-
239
-
240
-
241
-
242
-
243
-
244
-
245
-
246
-
247
-
248
 |
 |
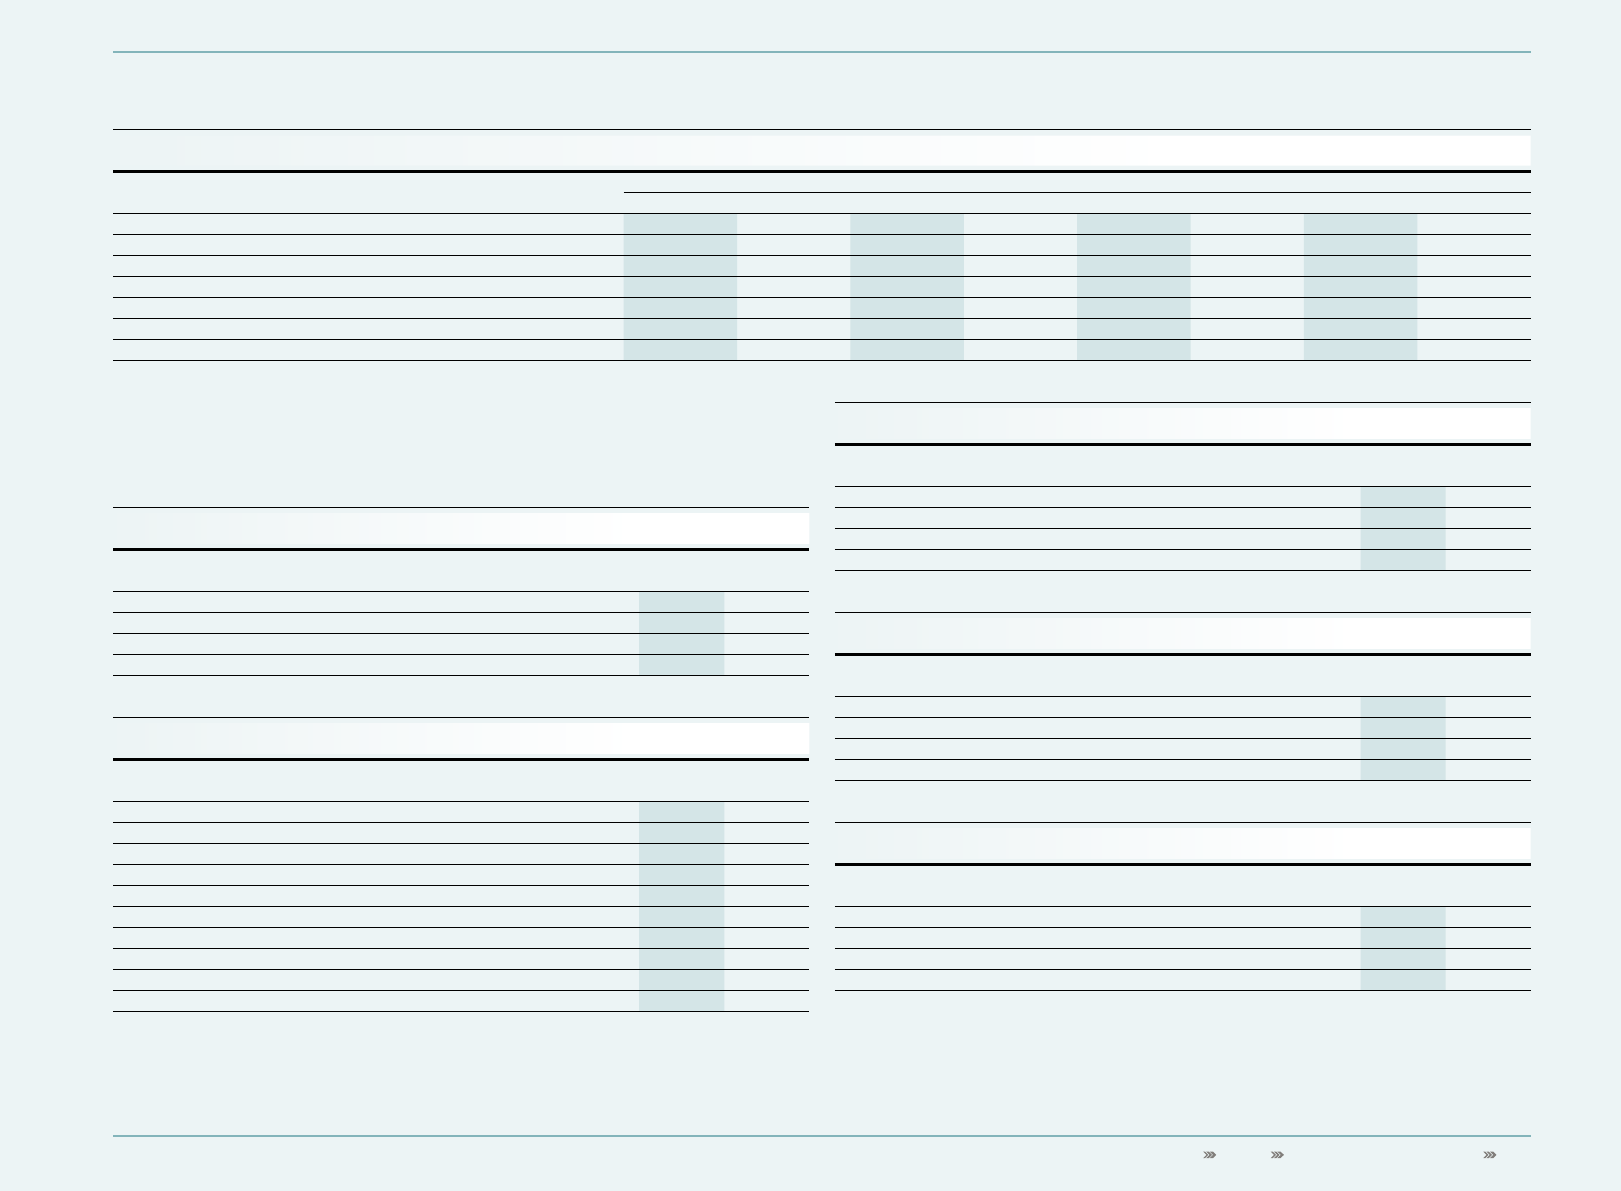
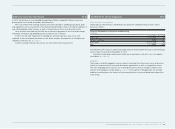
Consolidated Financial Statements Notes Notes – Additional Information 219
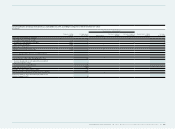
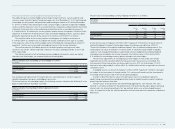
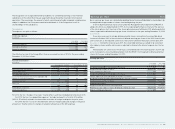
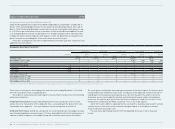
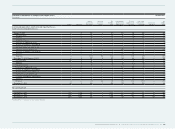
Segments
€ in millions
Wholesale Retail Other Businesses Total Segments
2010 2009 2010 2009 2010 2009 2010 2009
Net sales (non-Group) 8,181 7,164 2,389 1,906 1,420 1,293 11,990 10,363
Segmental operating profit 2,572 2,342 452 259 369 283 3,393 2,884
Segmental assets 2,690 1,938 541 429 514 420 3,745 2,787
Segmental liabilities 537 470 76 37 110 78 723 585
Capital expenditure 33 24 61 71 26 23 120 118
Depreciation and amortisation 22 24 88 88 8 6 118 118
Impairment losses, net of reversals of impairment losses (1) 0 4 14 0 0 3 14
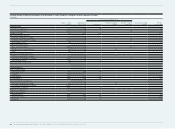
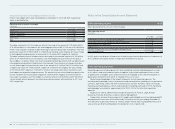
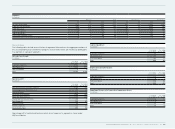
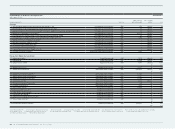
ReconciliationsReconciliations
The following tables include reconciliations of segmental information to the aggregate numbers of
the consolidated financial statements taking into account items which are not directly attributable
to a segment or a group of segments.
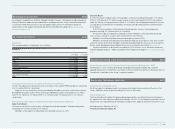
Net sales (non-Group)
€ in millions
Year ending
Dec. 31, 2010 Year ending
Dec. 31, 2009
Reportable segments 10,570 9,070
Other businesses 1,420 1,293
HQ/Consolidation 0 18
Total 11,990 10,381
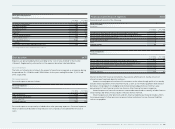
Operating profit
€ in millions
Year ending
Dec. 31, 2010 Year ending
Dec. 31, 2009
Operating profit for reportable segments 3,024 2,601
Operating profit for other businesses 369 283
HQ/Consolidation 212 51
Marketing working budget 1,288 1,028
Other operating expenses 1,523 1,485
Royalty and commission income 100 86
Operating profit 894 508
Financial income 25 19
Financial expenses 113 169
Income before taxes 806 358
Operating profit of centralised functions which do not represent a segment is shown under
HQ/Consolidation.
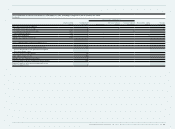
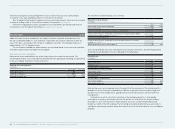
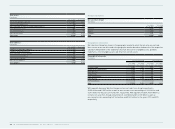
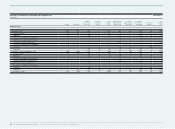
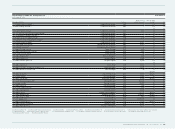
Capital expenditure
€ in millions
Year ending
Dec. 31, 2010 Year ending
Dec. 31, 2009
Reportable segments 94 95
Other businesses 26 23
HQ/Consolidation 149 122
Total 269 240
Depreciation and amortisation
€ in millions
Year ending
Dec. 31, 2010 Year ending
Dec. 31, 2009
Reportable segments 110 112
Other businesses 8 6
HQ/Consolidation 128 141
Total 246 259
Impairment losses, net of reversals of impairment losses
€ in millions
Year ending
Dec. 31, 2010 Year ending
Dec. 31, 2009
Reportable segments 3 14
Other businesses 0 0
HQ/Consolidation 11 21
Total 14 35