Reebok 2010 Annual Report Download - page 221
Download and view the complete annual report
Please find page 221 of the 2010 Reebok annual report below. You can navigate through the pages in the report by either clicking on the pages listed below, or by using the keyword search tool below to find specific information within the annual report.-
 1
1 -
2
-
3
-
4
-
5
-
6
-
7
-
8
-
9
-
10
-
11
-
12
-
13
-
14
-
15
-
16
-
17
-
18
-
19
-
20
-
21
-
22
-
23
-
24
-
25
-
26
-
27
-
28
-
29
-
30
-
31
-
32
-
33
-
34
-
35
-
36
-
37
-
38
-
39
-
40
-
41
-
42
-
43
-
44
-
45
-
46
-
47
-
48
-
49
-
50
-
51
-
52
-
53
-
54
-
55
-
56
-
57
-
58
-
59
-
60
-
61
-
62
-
63
-
64
-
65
-
66
-
67
-
68
-
69
-
70
-
71
-
72
-
73
-
74
-
75
-
76
-
77
-
78
-
79
-
80
-
81
-
82
-
83
-
84
-
85
-
86
-
87
-
88
-
89
-
90
-
91
-
92
-
93
-
94
-
95
-
96
-
97
-
98
-
99
-
100
-
101
-
102
-
103
-
104
-
105
-
106
-
107
-
108
-
109
-
110
-
111
-
112
-
113
-
114
-
115
-
116
-
117
-
118
-
119
-
120
-
121
-
122
-
123
-
124
-
125
-
126
-
127
-
128
-
129
-
130
-
131
-
132
-
133
-
134
-
135
-
136
-
137
-
138
-
139
-
140
-
141
-
142
-
143
-
144
-
145
-
146
-
147
-
148
-
149
-
150
-
151
-
152
-
153
-
154
-
155
-
156
-
157
-
158
-
159
-
160
-
161
-
162
-
163
-
164
-
165
-
166
-
167
-
168
-
169
-
170
-
171
-
172
-
173
-
174
-
175
-
176
-
177
-
178
-
179
-
180
-
181
-
182
-
183
-
184
-
185
-
186
-
187
-
188
-
189
-
190
-
191
-
192
-
193
-
194
-
195
-
196
-
197
-
198
-
199
-
200
-
201
-
202
-
203
-
204
-
205
-
206
-
207
-
208
-
209
-
210
-
 211
211 -
 212
212 -
 213
213 -
 214
214 -
 215
215 -
 216
216 -
 217
217 -
 218
218 -
 219
219 -
 220
220 -
 221
221 -
 222
222 -
 223
223 -
 224
224 -
 225
225 -
 226
226 -
 227
227 -
 228
228 -
 229
229 -
 230
230 -
 231
231 -
232
-
233
-
234
-
235
-
236
-
237
-
238
-
239
-
240
-
241
-
242
-
243
-
244
-
245
-
246
-
247
-
248
 |
 |

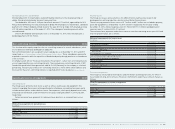
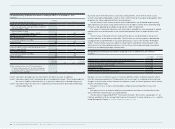
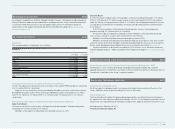
Consolidated Financial Statements Notes Notes to the Consolidated Income Statement 217
The Group does not recognise deferred tax liabilities for unremitted earnings of non-German
subsidiaries to the extent that they are expected to be permanently invested in international
operations. These earnings, the amount of which cannot be practicably computed, could become
subject to additional tax if they were remitted as dividends or if the Group were to sell its
shareholdings in the subsidiaries.
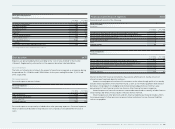
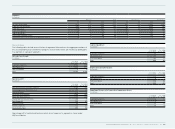
Tax expenses Tax expenses
Tax expenses are split as follows:
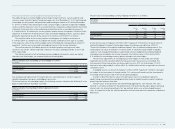
Income tax expenses
€ in millions
Year ending
Dec. 31, 2010 Year ending
Dec. 31, 2009
Current tax expenses 314 156
Deferred tax (income) (76) (43)
Income tax expenses 238 113
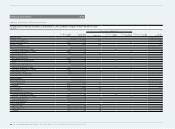
The effective tax rate of the Group differs from an assumed tax rate of 30% for the year ending
December 31, 2010 as follows:
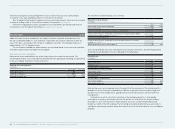
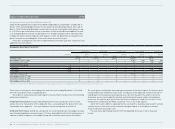
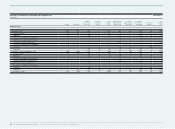
Tax rate reconciliation
€ in millions
Year ending Dec. 31, 2010 Year ending Dec. 31, 2009
€ in millions in % € in millions in %
Expected income tax expenses 242 30.0 108 30.0
Tax rate differentials (89) (11.0) (94) (26.1)
Non-deductible expenses 43 5.3 (36) (10.1)
Losses for which benefits were not recognisable and
changes in valuation allowances 8 1.0 119 33.2
Changes in tax rates (11) (1.4) 4 1.1
Other, net 1 0.1 1 0.3
194 24.0 102 28.3
Withholding tax expenses 44 5.5 11 3.1
Income tax expenses 238 29.5 113 31.5
For 2010, the line “changes in tax rates” mainly reflects a UK tax rate deduction effective in 2011.
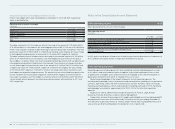
For 2010, the line “non-deductible expenses” includes tax benefits of in total € 14 million
(2009: € 57 million) related to the favourable resolution of foreign tax disputes for prior years.
For 2009, the line “losses for which benefits were not recognisable and changes in valuation
allowances” mainly relates to changes in valuation allowances of the US tax group.
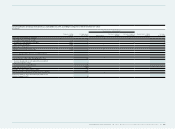
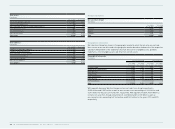
Earnings per share 34
Basic earnings per share are calculated by dividing the net income attributable to shareholders by
the weighted average number of shares outstanding during the year.
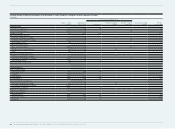
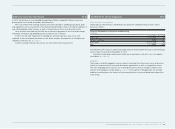
In 2009, dilutive potential shares arose under the Management Share Option Plan (MSOP) of
adidas AG, which was implemented in 1999. As the required performance criteria for the exercise
of the stock options of all tranches of the share option plan were fulfilled in 2009, dilutive potential
shares impacted the diluted earnings per share calculation for the year ending December 31, 2009
see Note 38.
It was also necessary to include dilutive potential shares arising from the convertible bond
issuance in October 2003 in the calculation of diluted earnings per share of the 2009 financial year
until conversion as the required conversion criteria were fulfilled at the balance sheet date 2009
see Note 17. During the financial year 2009, the convertible bond was assumed to be converted
into ordinary shares and the net income is adjusted to eliminate the interest expense less the tax
effect.
Following the full conversion of the Group’s convertible bond in the fourth quarter of 2009 and
as no share options are outstanding anymore from the MSOP, the Group had no dilutive potential
shares for the year ending December 31, 2010.
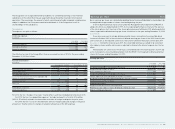
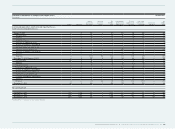
Earnings per share
Year ending
Dec. 31, 2010 Year ending
Dec. 31, 2009
Net income attributable to shareholders (€ in millions) 567 245
Weighted average number of shares 209,216,186 196,220,166
Basic earnings per share (in €) 2.71 1.25
Net income attributable to shareholders (€ in millions) 567 245
Interest expense on convertible bond, net of taxes (€ in millions) — 10
Net income used to determine diluted earnings per share (€ in millions) 567 255
Weighted average number of shares 209,216,186 196,220,166
Weighted share options — 34,369
Weighted assumed conversion convertible bond — 12,983,564
Weighted average number of shares for diluted earnings per share 209,216,186 209,238,099
Diluted earnings per share (in €) 2.71 1.22