Reebok 2010 Annual Report Download - page 136
Download and view the complete annual report
Please find page 136 of the 2010 Reebok annual report below. You can navigate through the pages in the report by either clicking on the pages listed below, or by using the keyword search tool below to find specific information within the annual report.-
 1
1 -
2
-
3
-
4
-
5
-
6
-
7
-
8
-
9
-
10
-
11
-
12
-
13
-
14
-
15
-
16
-
17
-
18
-
19
-
20
-
21
-
22
-
23
-
24
-
25
-
26
-
27
-
28
-
29
-
30
-
31
-
32
-
33
-
34
-
35
-
36
-
37
-
38
-
39
-
40
-
41
-
42
-
43
-
44
-
45
-
46
-
47
-
48
-
49
-
50
-
51
-
52
-
53
-
54
-
55
-
56
-
57
-
58
-
59
-
60
-
61
-
62
-
63
-
64
-
65
-
66
-
67
-
68
-
69
-
70
-
71
-
72
-
73
-
74
-
75
-
76
-
77
-
78
-
79
-
80
-
81
-
82
-
83
-
84
-
85
-
86
-
87
-
88
-
89
-
90
-
91
-
92
-
93
-
94
-
95
-
96
-
97
-
98
-
99
-
100
-
101
-
102
-
103
-
104
-
105
-
106
-
107
-
108
-
109
-
110
-
111
-
112
-
113
-
114
-
115
-
116
-
117
-
118
-
119
-
120
-
121
-
122
-
123
-
124
-
125
-
 126
126 -
 127
127 -
 128
128 -
 129
129 -
 130
130 -
 131
131 -
 132
132 -
 133
133 -
 134
134 -
 135
135 -
 136
136 -
 137
137 -
 138
138 -
 139
139 -
 140
140 -
 141
141 -
 142
142 -
 143
143 -
 144
144 -
 145
145 -
 146
146 -
147
-
148
-
149
-
150
-
151
-
152
-
153
-
154
-
155
-
156
-
157
-
158
-
159
-
160
-
161
-
162
-
163
-
164
-
165
-
166
-
167
-
168
-
169
-
170
-
171
-
172
-
173
-
174
-
175
-
176
-
177
-
178
-
179
-
180
-
181
-
182
-
183
-
184
-
185
-
186
-
187
-
188
-
189
-
190
-
191
-
192
-
193
-
194
-
195
-
196
-
197
-
198
-
199
-
200
-
201
-
202
-
203
-
204
-
205
-
206
-
207
-
208
-
209
-
210
-
211
-
212
-
213
-
214
-
215
-
216
-
217
-
218
-
219
-
220
-
221
-
222
-
223
-
224
-
225
-
226
-
227
-
228
-
229
-
230
-
231
-
232
-
233
-
234
-
235
-
236
-
237
-
238
-
239
-
240
-
241
-
242
-
243
-
244
-
245
-
246
-
247
-
248
 |
 |
132 Group Management Report – Financial Review Group Business Performance Economic and Sector Development
North American sporting goods industry
driven by volume and average price
increases
In the USA, we estimate that sporting
goods sales increased at a mid-single-
digit rate in 2010, driven by increases in
average selling prices and volumes. Lean
inventory levels in the first half of 2010
helped retailers minimise promotion and
discounting activities, thus driving up
average prices for the industry. Improving
momentum was also supported by
increasing levels of consumer spending
with both the back-to-school and holiday
season recording strong results in the
second half. Footwear sales are projected
to have increased at a high-single-digit
rate in 2010, driven in particular by
growth in the toning, running, basketball
and outdoor categories. Increasing
demand for functional apparel helped to
offset declines in licensed apparel. The
equipment market in the region remained
subdued, with the golf market seeing
further declines in 2010.
Asian sporting goods industry expands
Asia’s sporting goods industry grew
at a high-single-digit rate in 2010,
primarily driven by the region’s emerging
economies. In China, rising levels of
domestic demand and increasing wages
as well as continued retail expansion
resulted in a growth rate of around 20%
for the industry. In Japan, however, in line
with the overall weakness in consumer
spending, the sporting goods industry
declined in 2010. While the toning
category provided some positive impetus
on footwear, in general, both footwear
and apparel sales at retail remained
highly promotional in Japan.
Positive momentum in Latin American
sporting goods market continues
In 2010, the Latin American sporting
goods industry recorded a strong
performance with a double-digit growth
rate. The substantial economic growth
in the region in 2010 coupled with the
positive effects of the FIFA World Cup
resulted in relatively high consumer
spending on sporting goods, particularly
in the football category.
adidas Group and competitors
outperform economic environment
adidas Group revenues and profitability
as well as those of many competitors
and retailers increased in 2010. In
most regions, sales of our Group and
other major sporting goods companies
increased more significantly than GDP
and overall consumer spending.
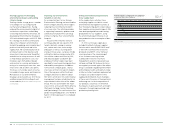
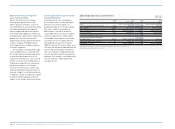
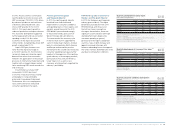
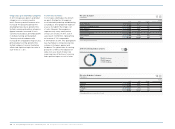
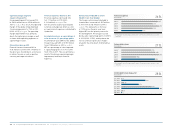
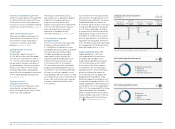
Exchange rate development 1 )
€ 1 equals
Average
rate 2009 Q1 2010 Q2 2010 Q3 2010 Q4 2010 Average
rate 2010
USD 1.3932 1.3479 1.2271 1.3648 1.3362 1.3279
GBP 0.8912 0.8898 0.8175 0.8600 0.8608 0.8584
JPY 130.23 125.93 108.79 113.68 108.65 116.56
RUB 44.144 39.695 38.282 41.692 40.820 40.303
CNY 9.5148 9.2006 8.3269 9.1457 8.8493 8.9885
1) Spot rates at quarter-end.
05
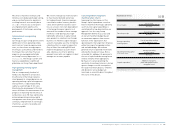
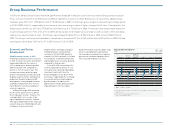
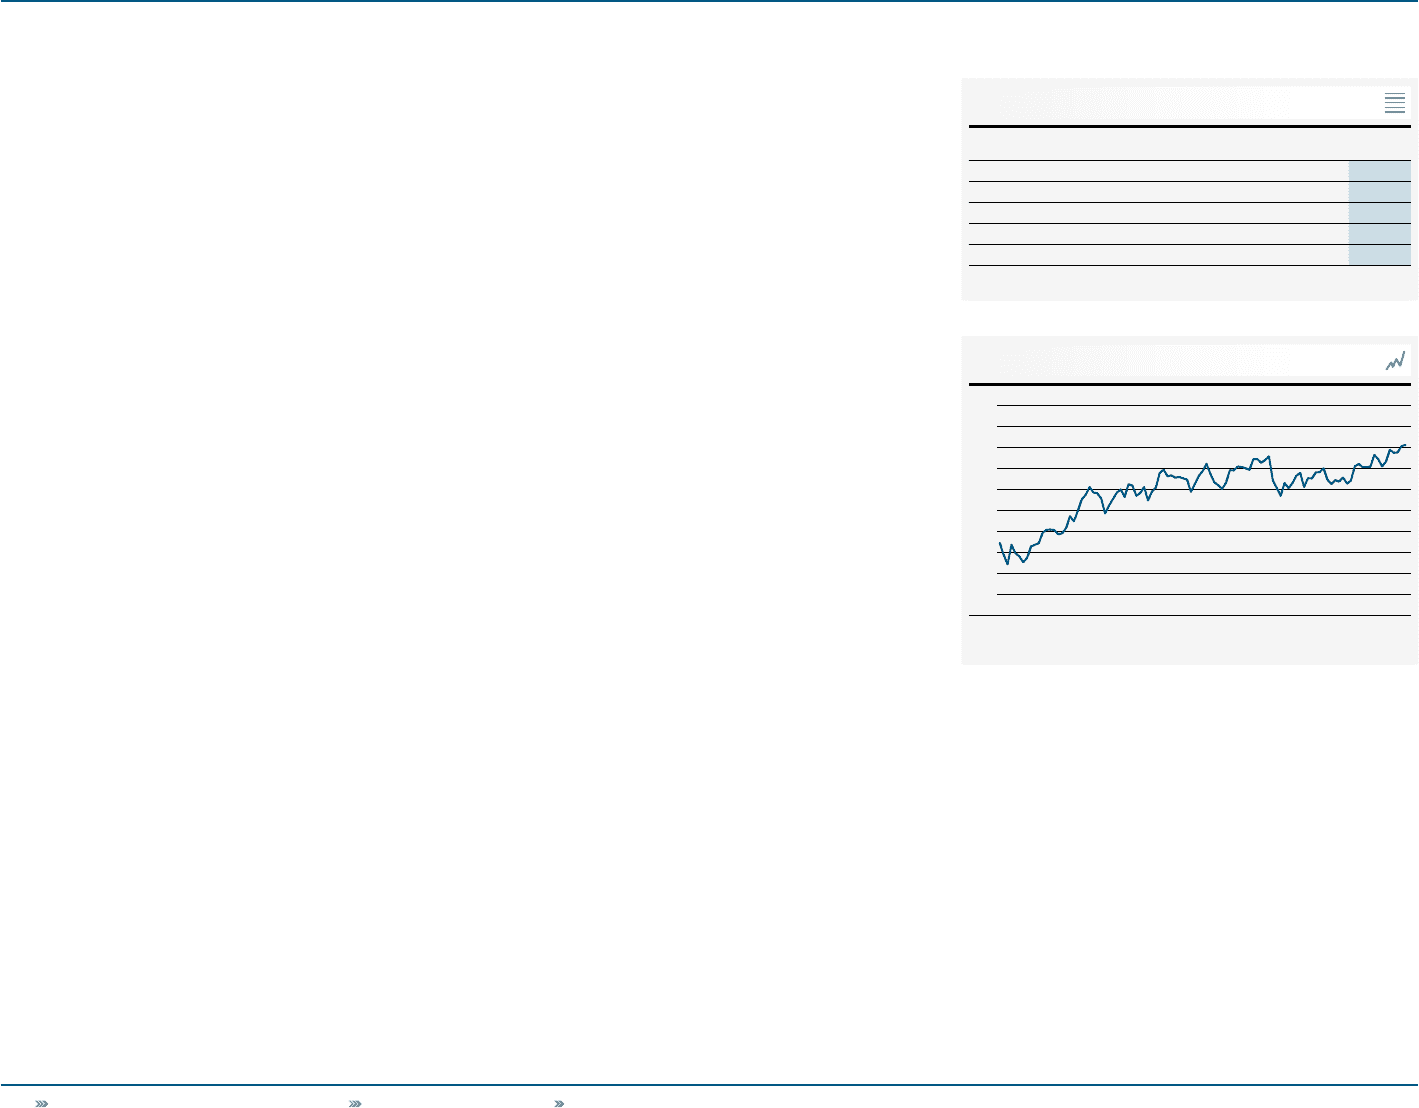
Oil price development 1 )
in US $
Jan. 1, 2009 Dec. 31, 2010
100
80
60
40
20
1) West Texas Intermediate Cushing crude oil.
Source: Bloomberg.
06