Reebok 2010 Annual Report Download - page 180
Download and view the complete annual report
Please find page 180 of the 2010 Reebok annual report below. You can navigate through the pages in the report by either clicking on the pages listed below, or by using the keyword search tool below to find specific information within the annual report.-
 1
1 -
2
-
3
-
4
-
5
-
6
-
7
-
8
-
9
-
10
-
11
-
12
-
13
-
14
-
15
-
16
-
17
-
18
-
19
-
20
-
21
-
22
-
23
-
24
-
25
-
26
-
27
-
28
-
29
-
30
-
31
-
32
-
33
-
34
-
35
-
36
-
37
-
38
-
39
-
40
-
41
-
42
-
43
-
44
-
45
-
46
-
47
-
48
-
49
-
50
-
51
-
52
-
53
-
54
-
55
-
56
-
57
-
58
-
59
-
60
-
61
-
62
-
63
-
64
-
65
-
66
-
67
-
68
-
69
-
70
-
71
-
72
-
73
-
74
-
75
-
76
-
77
-
78
-
79
-
80
-
81
-
82
-
83
-
84
-
85
-
86
-
87
-
88
-
89
-
90
-
91
-
92
-
93
-
94
-
95
-
96
-
97
-
98
-
99
-
100
-
101
-
102
-
103
-
104
-
105
-
106
-
107
-
108
-
109
-
110
-
111
-
112
-
113
-
114
-
115
-
116
-
117
-
118
-
119
-
120
-
121
-
122
-
123
-
124
-
125
-
126
-
127
-
128
-
129
-
130
-
131
-
132
-
133
-
134
-
135
-
136
-
137
-
138
-
139
-
140
-
141
-
142
-
143
-
144
-
145
-
146
-
147
-
148
-
149
-
150
-
151
-
152
-
153
-
154
-
155
-
156
-
157
-
158
-
159
-
160
-
161
-
162
-
163
-
164
-
165
-
166
-
167
-
168
-
169
-
 170
170 -
 171
171 -
 172
172 -
 173
173 -
 174
174 -
 175
175 -
 176
176 -
 177
177 -
 178
178 -
 179
179 -
 180
180 -
 181
181 -
 182
182 -
 183
183 -
 184
184 -
 185
185 -
 186
186 -
 187
187 -
 188
188 -
 189
189 -
 190
190 -
191
-
192
-
193
-
194
-
195
-
196
-
197
-
198
-
199
-
200
-
201
-
202
-
203
-
204
-
205
-
206
-
207
-
208
-
209
-
210
-
211
-
212
-
213
-
214
-
215
-
216
-
217
-
218
-
219
-
220
-
221
-
222
-
223
-
224
-
225
-
226
-
227
-
228
-
229
-
230
-
231
-
232
-
233
-
234
-
235
-
236
-
237
-
238
-
239
-
240
-
241
-
242
-
243
-
244
-
245
-
246
-
247
-
248
 |
 |
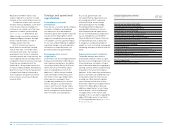
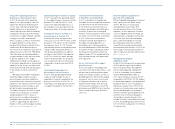
176 Group Management Report – Financial Review Subsequent Events and Outlook
adidas Group currency-neutral sales to
increase at a mid- to high-single-digit
rate in 2011
We expect adidas Group sales to increase
at a mid- to high-single-digit rate on
a currency-neutral basis in 2011. The
positive sales development will be
driven by rising consumer confidence
as the global economy continues to
improve. The positive impacts of our
high exposure to fast-growing emerging
markets, the further expansion of Retail
as well as continued momentum at the
Reebok brand will more than offset the
non-recurrence of sales related to the
2010 FIFA World Cup. As a result, we
expect the adidas Group to outperform
global economic growth in 2011.
Currency-neutral Wholesale
revenues expected to increase
at a mid-single-digit rate
We project currency-neutral Wholesale
segment revenues to increase at a
mid-single-digit rate compared to the
prior year. Order backlog development
as well as positive retailer and trade
show feedback support our growth
expectations for 2011. Currency-neutral
adidas Sport Performance sales are
forecasted to increase at a low- to
mid-single-digit rate due to growth in
key categories such as running and
training. adidas Sport Style revenues are
projected to increase at a high-single-
to low-double-digit rate on a currency-
neutral basis as a result of the expanded
distribution scope and continued
momentum in our product lines, in
particular adidas NEO. Currency-neutral
Reebok sales are expected to increase
due to growth in the women’s fitness
and men’s training category as well as
increases in the Classics business.
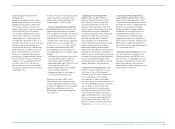
Retail sales to increase at a low-double-
digit rate on a currency-neutral basis
adidas Group currency-neutral Retail
segment sales are projected to grow at a
low-double-digit rate in 2011. Expansion
of the Group’s own-retail store base and
comparable store sales are expected to
contribute at a similar rate to the revenue
growth. The Group expects a net increase
of its store base by around 100 adidas
and Reebok stores in 2011. We forecast to
open around 200 new stores, depending
on the availability of desired locations.
New stores will primarily be located in
emerging markets in Eastern Europe.
Approximately 100 stores will be closed
over the course of the year. Around 220
stores will be remodelled. Comparable
store sales are expected to increase at
a mid-single-digit rate compared to the
prior year. As a result of the forecasted
improvements in the consumer
environment in 2011, concept stores are
expected to perform slightly better than
factory outlets.
Currency-neutral sales of Other
Businesses to increase at a mid-
single-digit rate
In 2011, revenues of Other Businesses
are expected to increase at a mid-single-
digit rate on a currency-neutral basis.
TaylorMade-adidas Golf currency-neutral
sales are projected to grow at a low- to
mid-single-digit rate compared to the
prior year. Product launches in core
categories such as metalwoods, irons
and putters should support growth in
this segment against a slow recovery
in the global golf market. Revenues at
Rockport are forecasted to increase
at a high-single- to low-double-digit
rate as a result of improvements in the
brand’s product portfolio and own-retail
expansion. Sales at Reebok-CCM Hockey
are expected to grow at a low-single-digit
rate in 2011, mainly due to new product
introductions.
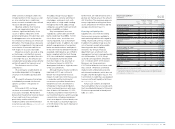
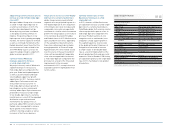
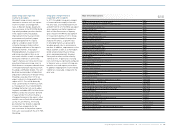
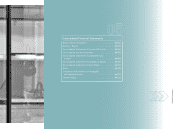
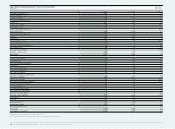
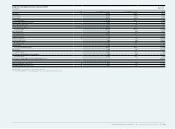
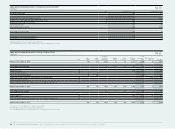
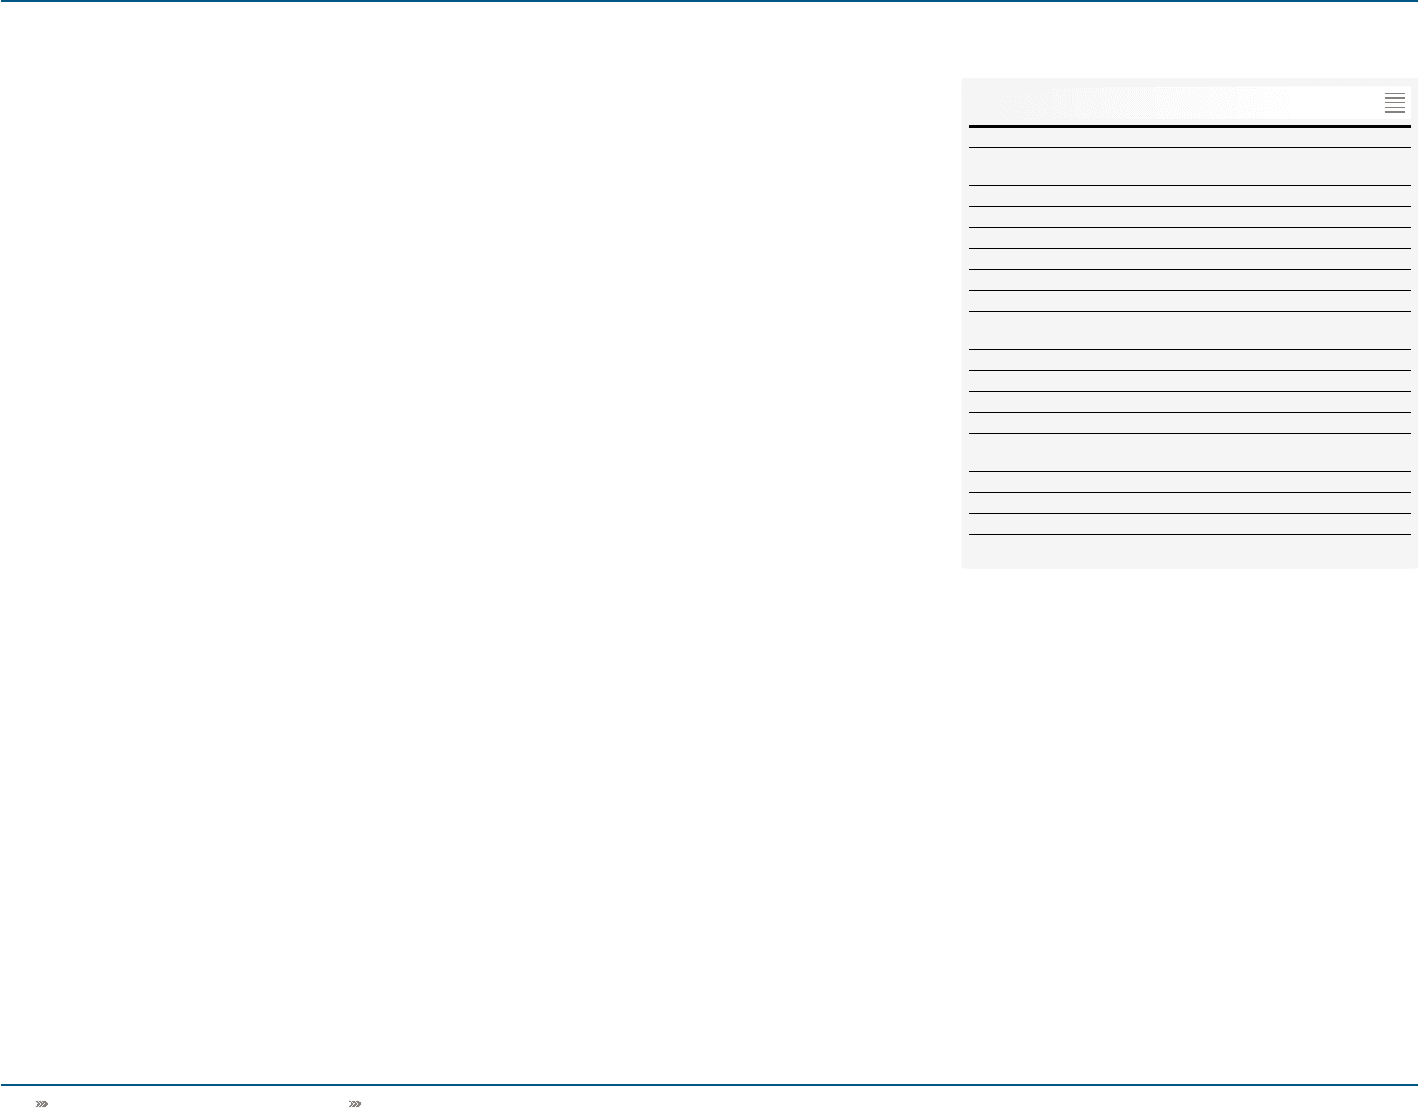
adidas Group 2011 Outlook
Currency-neutral sales
development (in %):
adidas Group mid- to high-single-digit increase
Wholesale mid-single-digit increase
Retail low-double-digit increase
Comparable store sales mid-single-digit increase
Other Businesses mid-single-digit increase
TaylorMade-adidas Golf low- to mid-single-digit increase
Rockport high-single- to low-double-digit
increase
Reebok-CCM Hockey low-single-digit increase
Gross margin 47.5% to 48.0%
Operating margin 7.5% to 8.0%
Earnings per share € 2.98 to € 3.12
Average operating working
capital as a percentage of sales increase
Capital expenditure 1 ) € 350 million to € 400 million
Store base net increase by around 100 stores
Net borrowings decline
1) Excluding acquisitions and finance leases.
01