Reebok 2010 Annual Report Download - page 143
Download and view the complete annual report
Please find page 143 of the 2010 Reebok annual report below. You can navigate through the pages in the report by either clicking on the pages listed below, or by using the keyword search tool below to find specific information within the annual report.-
 1
1 -
2
-
3
-
4
-
5
-
6
-
7
-
8
-
9
-
10
-
11
-
12
-
13
-
14
-
15
-
16
-
17
-
18
-
19
-
20
-
21
-
22
-
23
-
24
-
25
-
26
-
27
-
28
-
29
-
30
-
31
-
32
-
33
-
34
-
35
-
36
-
37
-
38
-
39
-
40
-
41
-
42
-
43
-
44
-
45
-
46
-
47
-
48
-
49
-
50
-
51
-
52
-
53
-
54
-
55
-
56
-
57
-
58
-
59
-
60
-
61
-
62
-
63
-
64
-
65
-
66
-
67
-
68
-
69
-
70
-
71
-
72
-
73
-
74
-
75
-
76
-
77
-
78
-
79
-
80
-
81
-
82
-
83
-
84
-
85
-
86
-
87
-
88
-
89
-
90
-
91
-
92
-
93
-
94
-
95
-
96
-
97
-
98
-
99
-
100
-
101
-
102
-
103
-
104
-
105
-
106
-
107
-
108
-
109
-
110
-
111
-
112
-
113
-
114
-
115
-
116
-
117
-
118
-
119
-
120
-
121
-
122
-
123
-
124
-
125
-
126
-
127
-
128
-
129
-
130
-
131
-
132
-
 133
133 -
 134
134 -
 135
135 -
 136
136 -
 137
137 -
 138
138 -
 139
139 -
 140
140 -
 141
141 -
 142
142 -
 143
143 -
 144
144 -
 145
145 -
 146
146 -
 147
147 -
 148
148 -
 149
149 -
 150
150 -
 151
151 -
 152
152 -
 153
153 -
154
-
155
-
156
-
157
-
158
-
159
-
160
-
161
-
162
-
163
-
164
-
165
-
166
-
167
-
168
-
169
-
170
-
171
-
172
-
173
-
174
-
175
-
176
-
177
-
178
-
179
-
180
-
181
-
182
-
183
-
184
-
185
-
186
-
187
-
188
-
189
-
190
-
191
-
192
-
193
-
194
-
195
-
196
-
197
-
198
-
199
-
200
-
201
-
202
-
203
-
204
-
205
-
206
-
207
-
208
-
209
-
210
-
211
-
212
-
213
-
214
-
215
-
216
-
217
-
218
-
219
-
220
-
221
-
222
-
223
-
224
-
225
-
226
-
227
-
228
-
229
-
230
-
231
-
232
-
233
-
234
-
235
-
236
-
237
-
238
-
239
-
240
-
241
-
242
-
243
-
244
-
245
-
246
-
247
-
248
 |
 |
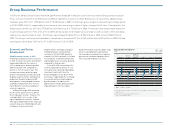
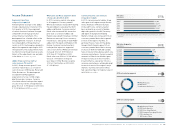
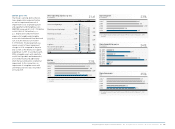
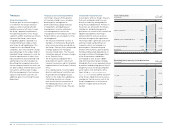
Group Management Report – Financial Review Group Business Performance Income Statement 139
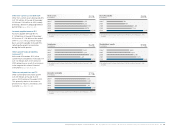
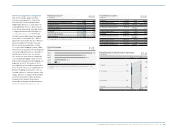
Diluted earnings per share
in €
1) Including Reebok, Rockport and Reebok-CCM Hockey from February 1, 2006
onwards.
Net income attributable to shareholders
€ in millions
1) Including Reebok, Rockport and Reebok-CCM Hockey from February 1, 2006
onwards.
31 29
2006 1 )
2007
2008
2009
2010
2006 1 )
2007
2008
2009
2010
2.25
2.57
3.07
1.22
2.71
483
551
642
245
567
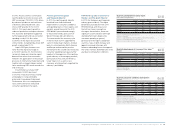
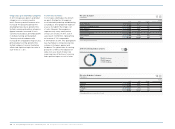
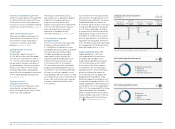
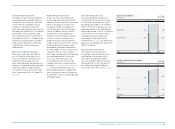
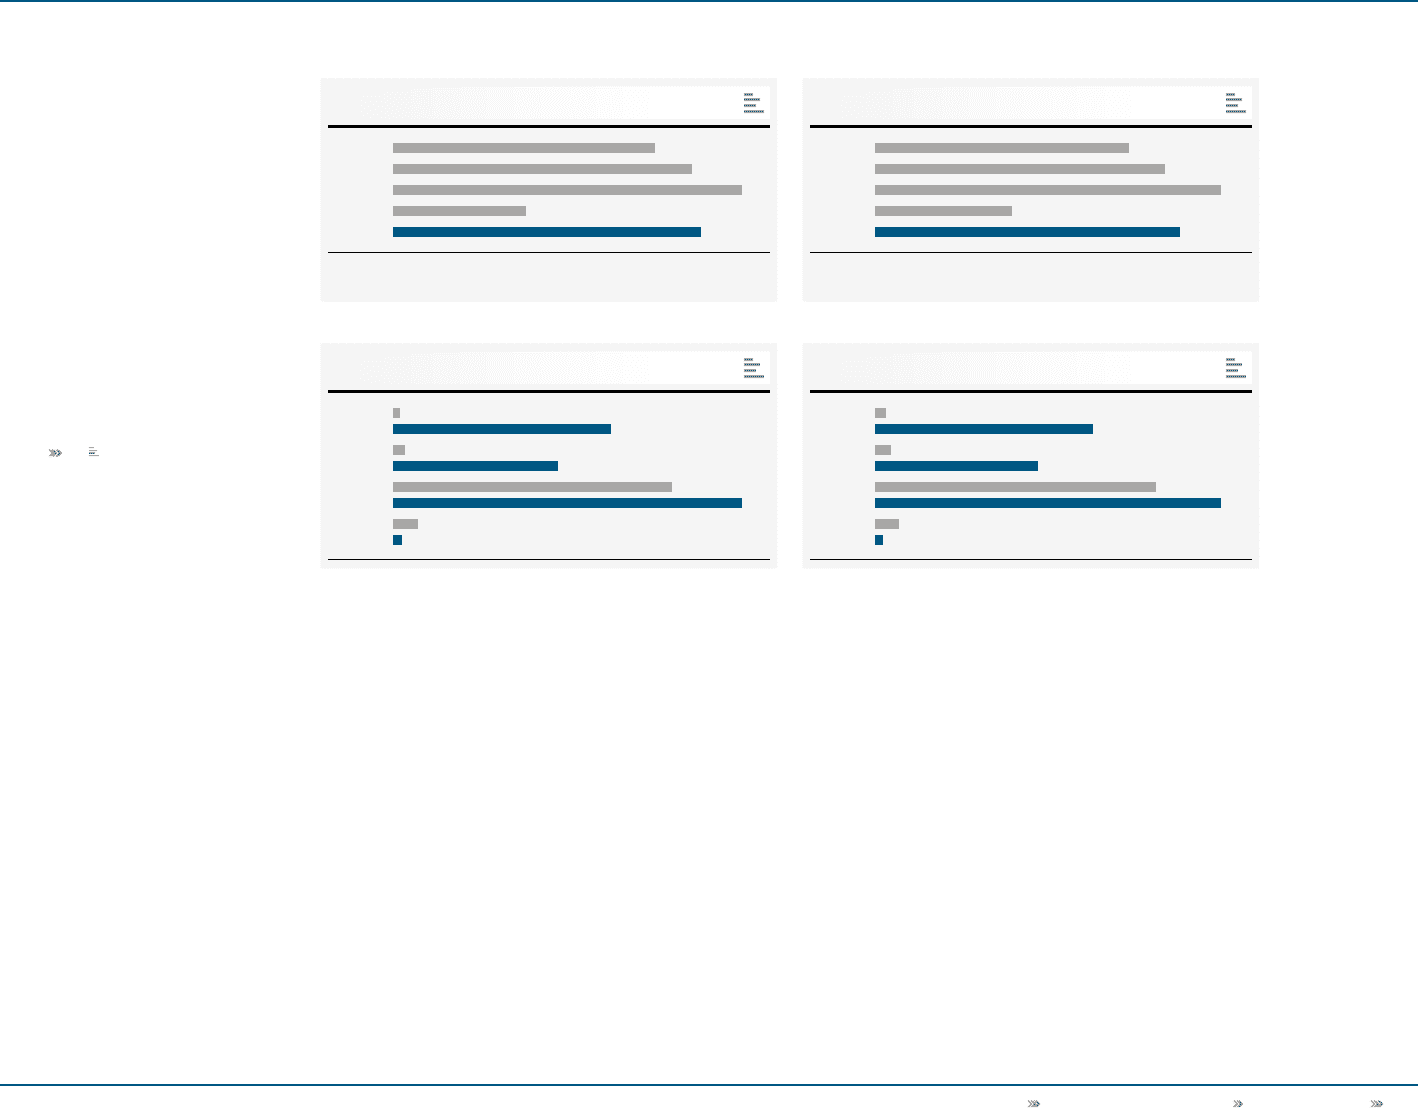
Diluted earnings per share by quarter
in €
Net income attributable to shareholders by quarter
€ in millions 32 30
Q1 2009
Q1 2010
Q2 2009
Q2 2010
Q3 2009
Q3 2010
Q4 2009
Q4 2010
Q1 2009
Q1 2010
Q2 2009
Q2 2010
Q3 2009
Q3 2010
Q4 2009
Q4 2010
0.04 0.80
0.06 0.60
1.03 1.27
0.09
0.03
5168
9126
213 266
19
7
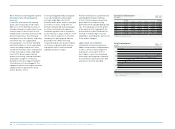
Net income attributable to non-
controlling interests increases
Net income attributable to
non-controlling interests rose to
€ 1 million in 2010, from € 0 million in
2009. This increase was primarily due
to higher profits at our joint venture in
Israel.
Earnings per share reach € 2.71
Following the full conversion of the
Group’s convertible bond in the fourth
quarter of 2009, the Group has no dilutive
potential shares anymore. As a result,
diluted earnings per share equal basic
earnings per share. In 2010, basic and
diluted earnings per share amounted to
€ 2.71 see 31. In the prior year period,
basic earnings per share amounted
to € 1.25 and diluted earnings per
share to € 1.22. The weighted average
number of shares used in the calculation
was 209,216,186 in 2010. In the prior
year period, the number amounted to
196,220,166 for the calculation of basic
earnings per share and 209,238,099 for
the calculation of diluted earnings per
share.