Reebok 2010 Annual Report Download - page 144
Download and view the complete annual report
Please find page 144 of the 2010 Reebok annual report below. You can navigate through the pages in the report by either clicking on the pages listed below, or by using the keyword search tool below to find specific information within the annual report.-
 1
1 -
2
-
3
-
4
-
5
-
6
-
7
-
8
-
9
-
10
-
11
-
12
-
13
-
14
-
15
-
16
-
17
-
18
-
19
-
20
-
21
-
22
-
23
-
24
-
25
-
26
-
27
-
28
-
29
-
30
-
31
-
32
-
33
-
34
-
35
-
36
-
37
-
38
-
39
-
40
-
41
-
42
-
43
-
44
-
45
-
46
-
47
-
48
-
49
-
50
-
51
-
52
-
53
-
54
-
55
-
56
-
57
-
58
-
59
-
60
-
61
-
62
-
63
-
64
-
65
-
66
-
67
-
68
-
69
-
70
-
71
-
72
-
73
-
74
-
75
-
76
-
77
-
78
-
79
-
80
-
81
-
82
-
83
-
84
-
85
-
86
-
87
-
88
-
89
-
90
-
91
-
92
-
93
-
94
-
95
-
96
-
97
-
98
-
99
-
100
-
101
-
102
-
103
-
104
-
105
-
106
-
107
-
108
-
109
-
110
-
111
-
112
-
113
-
114
-
115
-
116
-
117
-
118
-
119
-
120
-
121
-
122
-
123
-
124
-
125
-
126
-
127
-
128
-
129
-
130
-
131
-
132
-
133
-
 134
134 -
 135
135 -
 136
136 -
 137
137 -
 138
138 -
 139
139 -
 140
140 -
 141
141 -
 142
142 -
 143
143 -
 144
144 -
 145
145 -
 146
146 -
 147
147 -
 148
148 -
 149
149 -
 150
150 -
 151
151 -
 152
152 -
 153
153 -
 154
154 -
155
-
156
-
157
-
158
-
159
-
160
-
161
-
162
-
163
-
164
-
165
-
166
-
167
-
168
-
169
-
170
-
171
-
172
-
173
-
174
-
175
-
176
-
177
-
178
-
179
-
180
-
181
-
182
-
183
-
184
-
185
-
186
-
187
-
188
-
189
-
190
-
191
-
192
-
193
-
194
-
195
-
196
-
197
-
198
-
199
-
200
-
201
-
202
-
203
-
204
-
205
-
206
-
207
-
208
-
209
-
210
-
211
-
212
-
213
-
214
-
215
-
216
-
217
-
218
-
219
-
220
-
221
-
222
-
223
-
224
-
225
-
226
-
227
-
228
-
229
-
230
-
231
-
232
-
233
-
234
-
235
-
236
-
237
-
238
-
239
-
240
-
241
-
242
-
243
-
244
-
245
-
246
-
247
-
248
 |
 |
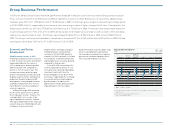
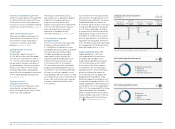
140 Group Management Report – Financial Review Group Business Performance Statement of Financial Position and Statement of Cash Flows
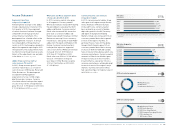
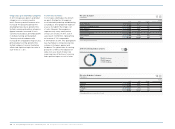
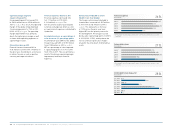
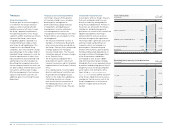
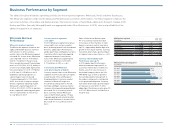
Structure of statement of financial position 1 )
in % of total assets
2010 2009
Total 100% 100%
Total assets (€ in millions) 10,618 8,875
1) For absolute figures see adidas AG consolidated statement of financial
position, p. 184.
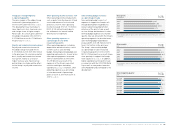
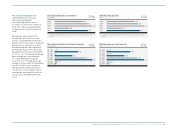
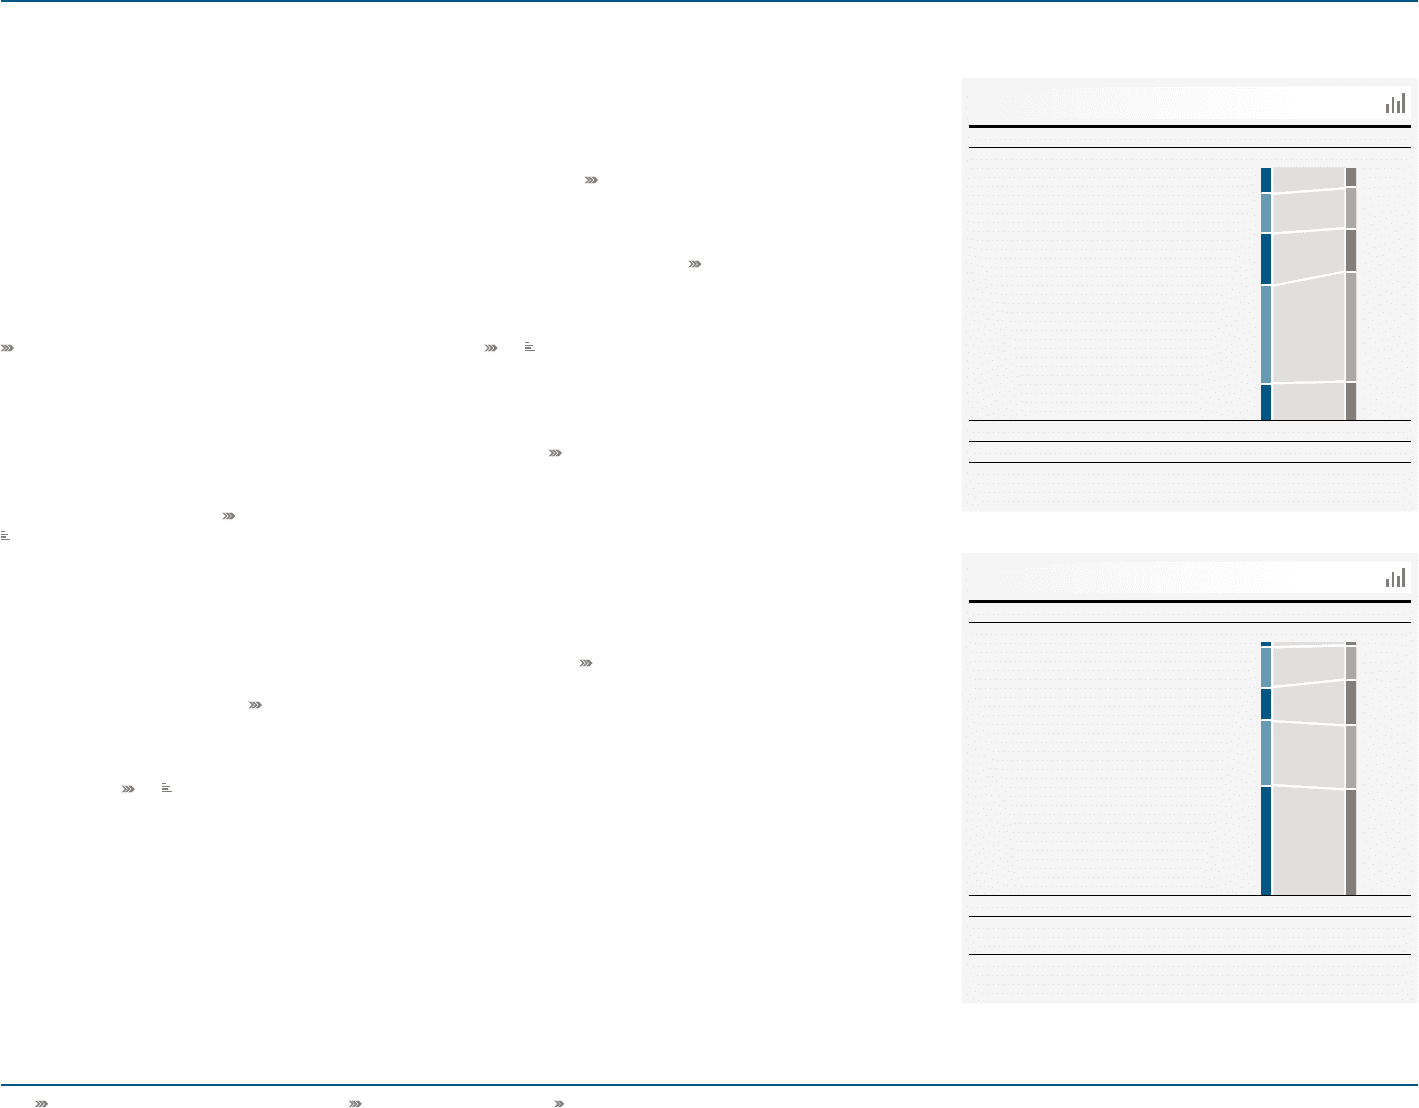
Structure of statement of financial position 1 )
in % of total liabilities and equity
2010 2009
Total 100% 100%
Total liabilities and equity
(€ in millions) 10,618 8,875
1) For absolute figures see adidas AG consolidated statement of financial
position, p. 184.
33
34
Cash and cash equivalents .........10.9%
Short-term borrowings .............2.6%
Accounts receivable ...............15.7%
Accounts payable .................16.0%
Inventories ......................20.0%
Long-term borrowings ............12.6%
Fixed assets .....................38.4%
Other liabilities ..................25.3%
Other assets .....................15.0%
Total equity ......................43.5%
8.7%
2.2%
16.1%
13.1%
16.6%
17.7%
42.8%
24.5%
15.8%
42.5%
Statement of Financial
Position and Statement
of Cash Flows
Changes in accounting policy
The Group’s consolidated financial
statements are prepared in accordance
with International Financial Reporting
Standards (IFRS as adopted by the EU).
In 2010, there were changes in IFRS,
which were reflected in the Group’s
consolidation and accounting principles
see Note 1, p. 188. However, the impact
on the Group’s consolidated financial
statements from any such changes was
not material in the reporting period.
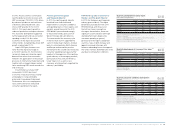
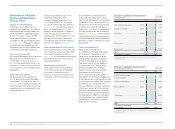
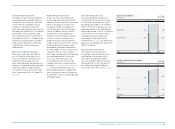
Total assets increase 20%
At the end of December 2010, total assets
grew 20% to € 10.618 billion versus
€ 8.875 billion in the prior year see
35. This was primarily the result of an
increase in current assets. An increase
in non-current assets also impacted this
development.
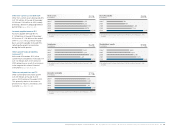
Group inventories up 44%
Group inventories increased 44% to
€ 2.119 billion at the end of December
2010 versus € 1.471 billion in 2009 see
Note 8, p. 197. On a currency-neutral basis,
inventories grew 34%, which reflects our
expectations for continued growth in the
coming quarters see 36.
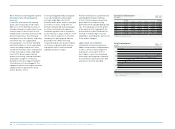
Accounts receivable increase 17%
At the end of December 2010,
Group receivables increased 17% to
€ 1.667 billion (2009: € 1.429 billion)
as a result of the Group sales growth
see Note 6, p. 196. On a currency-neutral
basis, receivables were up 7%. This
growth is lower than the 9% currency-
neutral Group sales increase in the
fourth quarter of 2010 and mirrors strict
discipline in the Group’s trade terms
management and concerted collection
efforts in all segments see 37.
Other current financial assets up 23%
Other current financial assets grew 23%
to € 197 million at the end of December
2010 from € 160 million in 2009 see
Note 7, p. 196. This development was mainly
due to the increase in the fair value of
financial instruments.
Other current assets up 8%
Other current assets increased 8% to
€ 390 million at the end of December
2010 from € 360 million in 2009,
mainly as a result of an increase in tax
receivables other than income taxes
see Note 9, p. 197.
Assets held for sale decrease 63%
At the end of December 2010, assets
held for sale declined 63% to € 47 million
compared to € 126 million in 2009. This
decrease was due to the reclassification
of certain assets held for sale back to
fixed assets, as it is not considered likely
that they will be sold in the foreseeable
future see Note 10, p. 197. Assets held for
sale primarily relate to the planned sale
of land and buildings in Herzogenaurach,
Germany, as well as a warehouse in the
Netherlands.
Fixed assets increase 7%
Fixed assets increased 7% to
€ 4.076 billion at the end of December
2010 versus € 3.794 billion in 2009.
Fixed assets include property, plant
and equipment, goodwill, trademarks
and other intangible assets as well as
long-term financial assets. Additions
in an amount of € 271 million were
primarily related to the continued
expansion of our own-retail activities,
investments into the Group’s IT
infrastructure as well as the further
development of the Group’s headquarters
in Herzogenaurach. A net transfer of fixed
assets from assets held for sale totalling
€ 76 million also contributed to the
increase. Moreover, currency translation
effects in an amount of € 216 million on
fixed assets denominated in currencies
other than the euro positively impacted
this development. Additions were partly
offset by depreciation and amortisation
amounting to € 263 million as well as
disposals of € 17 million.