Reebok 2010 Annual Report Download - page 160
Download and view the complete annual report
Please find page 160 of the 2010 Reebok annual report below. You can navigate through the pages in the report by either clicking on the pages listed below, or by using the keyword search tool below to find specific information within the annual report.-
 1
1 -
2
-
3
-
4
-
5
-
6
-
7
-
8
-
9
-
10
-
11
-
12
-
13
-
14
-
15
-
16
-
17
-
18
-
19
-
20
-
21
-
22
-
23
-
24
-
25
-
26
-
27
-
28
-
29
-
30
-
31
-
32
-
33
-
34
-
35
-
36
-
37
-
38
-
39
-
40
-
41
-
42
-
43
-
44
-
45
-
46
-
47
-
48
-
49
-
50
-
51
-
52
-
53
-
54
-
55
-
56
-
57
-
58
-
59
-
60
-
61
-
62
-
63
-
64
-
65
-
66
-
67
-
68
-
69
-
70
-
71
-
72
-
73
-
74
-
75
-
76
-
77
-
78
-
79
-
80
-
81
-
82
-
83
-
84
-
85
-
86
-
87
-
88
-
89
-
90
-
91
-
92
-
93
-
94
-
95
-
96
-
97
-
98
-
99
-
100
-
101
-
102
-
103
-
104
-
105
-
106
-
107
-
108
-
109
-
110
-
111
-
112
-
113
-
114
-
115
-
116
-
117
-
118
-
119
-
120
-
121
-
122
-
123
-
124
-
125
-
126
-
127
-
128
-
129
-
130
-
131
-
132
-
133
-
134
-
135
-
136
-
137
-
138
-
139
-
140
-
141
-
142
-
143
-
144
-
145
-
146
-
147
-
148
-
149
-
 150
150 -
 151
151 -
 152
152 -
 153
153 -
 154
154 -
 155
155 -
 156
156 -
 157
157 -
 158
158 -
 159
159 -
 160
160 -
 161
161 -
 162
162 -
 163
163 -
 164
164 -
 165
165 -
 166
166 -
 167
167 -
 168
168 -
 169
169 -
 170
170 -
171
-
172
-
173
-
174
-
175
-
176
-
177
-
178
-
179
-
180
-
181
-
182
-
183
-
184
-
185
-
186
-
187
-
188
-
189
-
190
-
191
-
192
-
193
-
194
-
195
-
196
-
197
-
198
-
199
-
200
-
201
-
202
-
203
-
204
-
205
-
206
-
207
-
208
-
209
-
210
-
211
-
212
-
213
-
214
-
215
-
216
-
217
-
218
-
219
-
220
-
221
-
222
-
223
-
224
-
225
-
226
-
227
-
228
-
229
-
230
-
231
-
232
-
233
-
234
-
235
-
236
-
237
-
238
-
239
-
240
-
241
-
242
-
243
-
244
-
245
-
246
-
247
-
248
 |
 |
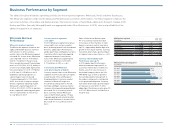
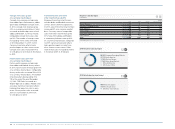
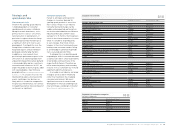
156 Group Management Report – Financial Review Business Performance by Segment Other Businesses Performance
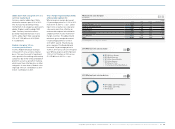
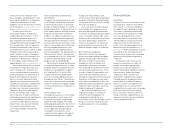
Other Businesses at a glance
€ in millions
2010 2009 Change
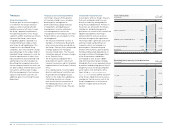
Net sales 1,420 1,293 10%
Gross profit 618 509 21%
Gross margin 43.5% 39.3% 4.2pp
Segmental operating profit 369 283 30%
Segmental operating margin 26.0% 21.9% 4.1pp
16
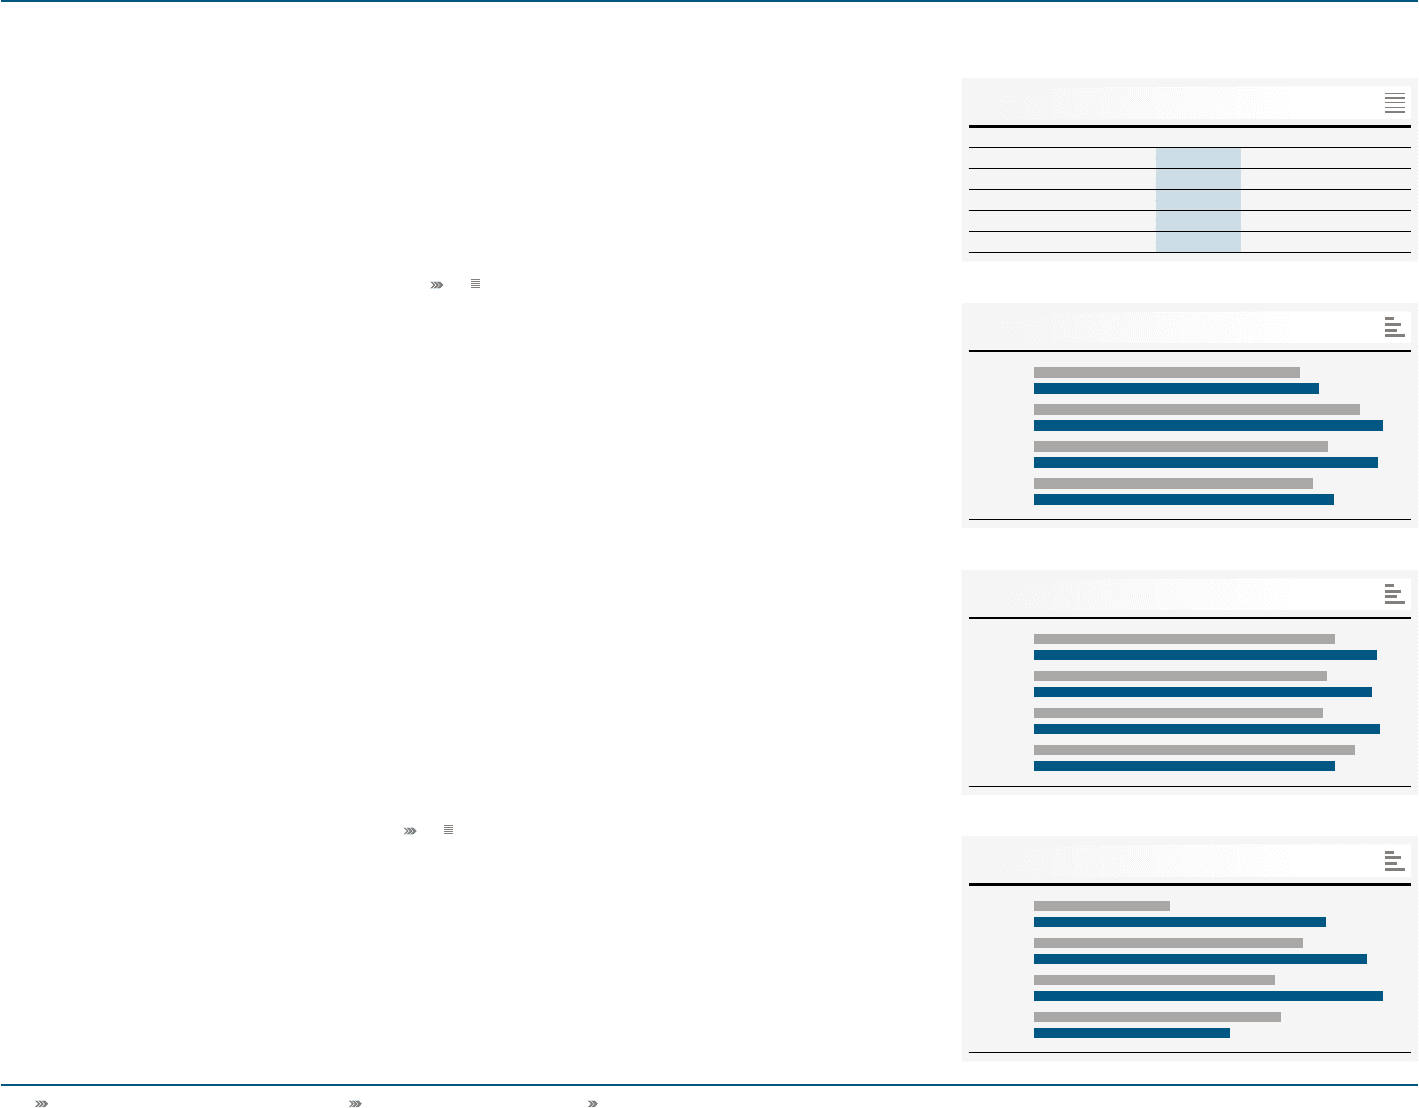
Other Businesses net sales by quarter
€ in millions 17
Q1 2009
Q1 2010
Q2 2009
Q2 2010
Q3 2009
Q3 2010
Q4 2009
Q4 2010
295
316
362387
326 382
310333
Other Businesses
Performance
Other Businesses results in summary
Other Businesses primarily include
the TaylorMade-adidas Golf, Rockport
and Reebok-CCM Hockey segments. In
addition, the segment Other Centrally
Managed Brands, which comprises
brands such as Y-3, is also included.
In 2010, currency-neutral sales of
Other Businesses increased 2%.
In euro terms, sales grew 10% to
€ 1.420 billion (2009: € 1.293 billion).
Gross margin increased 4.2 percentage
points to 43.5% (2009: 39.3%). This
was mainly a result of improving
product margins and a reduction
in clearance sales in the Rockport
segment. Gross profit improved 21% to
€ 618 million in 2010 from € 509 million
in 2009. As a result of the increase in
gross margin and stable segmental
operating expenses as a percentage
of sales, segmental operating margin
increased 4.1 percentage points to
26.0% (2009: 21.9%). In absolute
terms, segmental operating profit grew
30% to € 369 million in 2010 versus
€ 283 million in 2009.
Currency-neutral sales of
Other Businesses up 2%
In 2010, revenues for Other Businesses
increased 2% on a currency-neutral
basis, with sales growth in all segments.
Currency translation effects positively
impacted revenues in euro terms.
Sales of Other Businesses grew
10% to € 1.420 billion in 2010 (2009:
€ 1.293 billion) see 16.
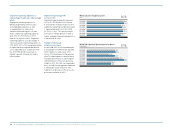
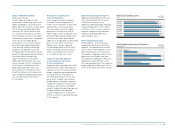
Currency-neutral sales of Other
Businesses grow in all regions
Currency-neutral sales of Other
Businesses increased in all regions.
Revenues in Western Europe were up
1% on a currency-neutral basis due to
sales growth at TaylorMade-adidas Golf
and Reebok-CCM Hockey, partly offset by
declines at Rockport. Sales in European
Emerging Markets increased 8% on a
currency-neutral basis, primarily driven
by higher Rockport and Reebok-CCM
Hockey sales. Currency-neutral sales in
North America were stable. Revenues
in Greater China were up 12% on a
currency-neutral basis as a result of
higher TaylorMade-adidas Golf sales.
Sales in Other Asian Markets grew 3%
on a currency-neutral basis, driven by
increases at Rockport. In Latin America,
currency-neutral sales grew 10% due to
increases at TaylorMade-adidas Golf and
Rockport. Currency translation effects
had a positive impact on regional sales in
euro terms see 20.
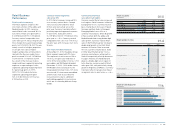
Currency-neutral TaylorMade-
adidas Golf sales increase 1%
In 2010, TaylorMade-adidas Golf
revenues increased 1% on a currency-
neutral basis. Growth was driven by
revenue increases in balls and irons,
with products such as the Penta TP ball
and the Burner irons contributing to this
expansion. Sales for adidas Golf also
increased, driven by both footwear and
apparel. Ashworth’s revenues declined
due to the non-recurrence of prior year
sales related to a licensing agreement
that was discontinued and product
clearance sales in 2009 to align the
brand with its new positioning. Currency
translation effects positively impacted
sales in euro terms. In 2010, TaylorMade-
adidas Golf revenues increased 9% to
€ 909 million from € 831 million in the
prior year.
Currency-neutral Rockport
sales grow 2%
In 2010, Rockport revenues increased 2%
on a currency-neutral basis. Growth in
the footwear category more than offset
a decline in accessories and apparel.
Regionally, Rockport’s revenues grew
significantly in Other Asian Markets,
particularly in Japan and South Korea,
more than offsetting declines in North
America. Currency translation effects
positively impacted sales in euro terms.
Revenues in the Rockport segment
increased 9% to € 252 million in 2010
from € 232 million in 2009.
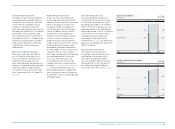
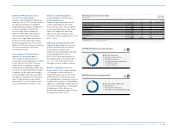
Other Businesses gross margin by quarter
in %
Other Businesses segmental operating profit
by quarter € in millions
18
19
Q1 2009
Q1 2010
Q2 2009
Q2 2010
Q3 2009
Q3 2010
Q4 2009
Q4 2010
Q1 2009
Q1 2010
Q2 2009
Q2 2010
Q3 2009
Q3 2010
Q4 2009
Q4 2010
39.4 45.0
38.3 44.2
37.8 45.3
42.0
39.4
43 92
85 105
76 110
78
62