Reebok 2010 Annual Report Download - page 113
Download and view the complete annual report
Please find page 113 of the 2010 Reebok annual report below. You can navigate through the pages in the report by either clicking on the pages listed below, or by using the keyword search tool below to find specific information within the annual report.-
 1
1 -
2
-
3
-
4
-
5
-
6
-
7
-
8
-
9
-
10
-
11
-
12
-
13
-
14
-
15
-
16
-
17
-
18
-
19
-
20
-
21
-
22
-
23
-
24
-
25
-
26
-
27
-
28
-
29
-
30
-
31
-
32
-
33
-
34
-
35
-
36
-
37
-
38
-
39
-
40
-
41
-
42
-
43
-
44
-
45
-
46
-
47
-
48
-
49
-
50
-
51
-
52
-
53
-
54
-
55
-
56
-
57
-
58
-
59
-
60
-
61
-
62
-
63
-
64
-
65
-
66
-
67
-
68
-
69
-
70
-
71
-
72
-
73
-
74
-
75
-
76
-
77
-
78
-
79
-
80
-
81
-
82
-
83
-
84
-
85
-
86
-
87
-
88
-
89
-
90
-
91
-
92
-
93
-
94
-
95
-
96
-
97
-
98
-
99
-
100
-
101
-
102
-
 103
103 -
 104
104 -
 105
105 -
 106
106 -
 107
107 -
 108
108 -
 109
109 -
 110
110 -
 111
111 -
 112
112 -
 113
113 -
 114
114 -
 115
115 -
 116
116 -
 117
117 -
 118
118 -
 119
119 -
 120
120 -
 121
121 -
 122
122 -
 123
123 -
124
-
125
-
126
-
127
-
128
-
129
-
130
-
131
-
132
-
133
-
134
-
135
-
136
-
137
-
138
-
139
-
140
-
141
-
142
-
143
-
144
-
145
-
146
-
147
-
148
-
149
-
150
-
151
-
152
-
153
-
154
-
155
-
156
-
157
-
158
-
159
-
160
-
161
-
162
-
163
-
164
-
165
-
166
-
167
-
168
-
169
-
170
-
171
-
172
-
173
-
174
-
175
-
176
-
177
-
178
-
179
-
180
-
181
-
182
-
183
-
184
-
185
-
186
-
187
-
188
-
189
-
190
-
191
-
192
-
193
-
194
-
195
-
196
-
197
-
198
-
199
-
200
-
201
-
202
-
203
-
204
-
205
-
206
-
207
-
208
-
209
-
210
-
211
-
212
-
213
-
214
-
215
-
216
-
217
-
218
-
219
-
220
-
221
-
222
-
223
-
224
-
225
-
226
-
227
-
228
-
229
-
230
-
231
-
232
-
233
-
234
-
235
-
236
-
237
-
238
-
239
-
240
-
241
-
242
-
243
-
244
-
245
-
246
-
247
-
248
 |
 |
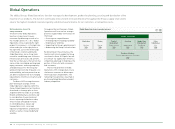
Group Management Report – Our Group Global Operations 109
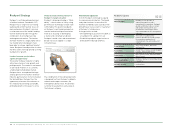
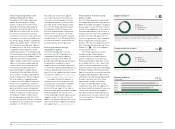
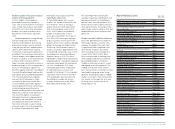
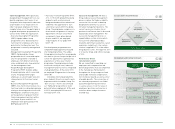
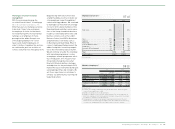
Apparel production by region 1 )
1) Figures include adidas, Reebok and adidas Golf.
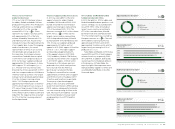
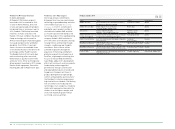
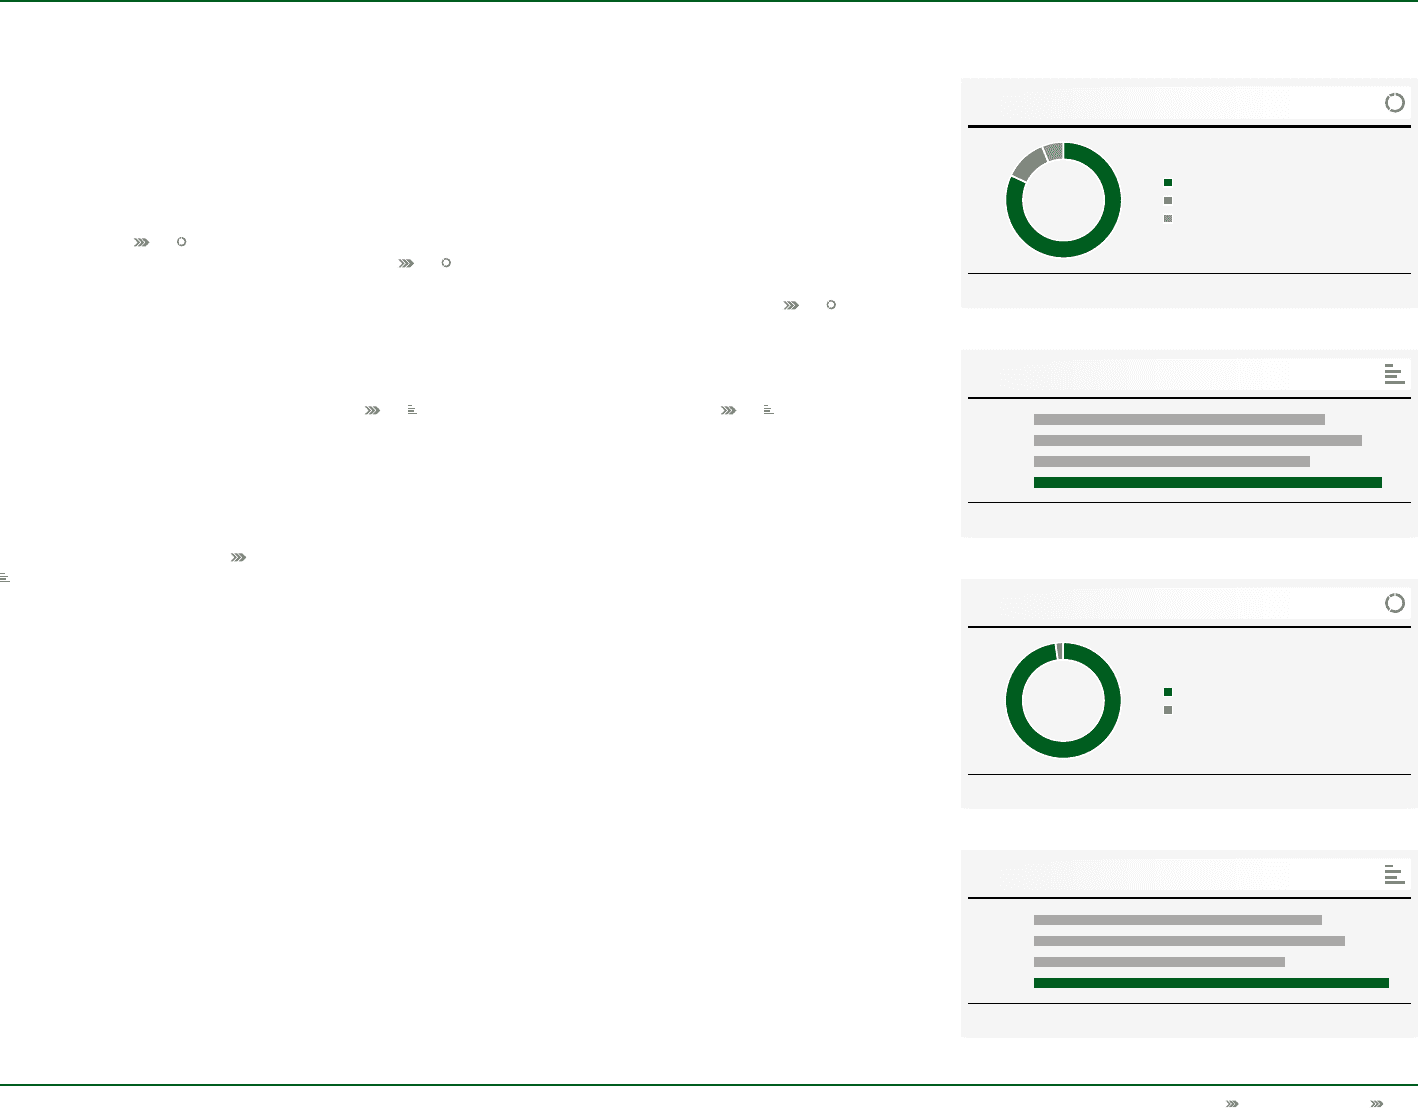
Hardware production by region 1 )
1) Figures include adidas, Reebok and adidas Golf.
06
08
82% Asia
12% Europe
6% Americas
98% Asia
2% Europe
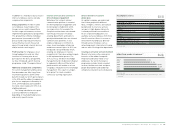
Apparel production 1 )
in million units
1) Figures include adidas, Reebok and adidas Golf.
Hardware production 1 )
in million units
1) Figures include adidas, Reebok and adidas Golf.
07
09
2007
2008
2009
2010
2007
2008
2009
2010
252
284
239
301
39
42
34
48
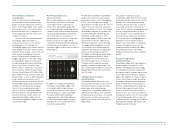
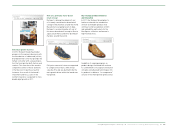
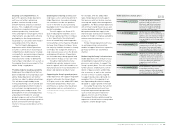
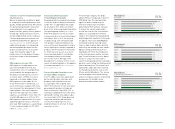
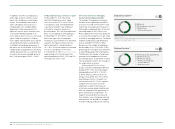
China’s share of footwear
production decreases
97% of our total 2010 footwear volume
for adidas, Reebok and adidas Golf was
produced in Asia (2009: 97%). Production
in Europe and the Americas combined
accounted for 3% of the sourcing
volume (2009: 3%) see 04. China
represents our largest sourcing country
with approximately 39% of the total
volume, followed by Vietnam with 31%
and Indonesia with 22%. As part of our
strategy to increase the regional diversity
of our supplier base to meet the ongoing
needs of our business, the overall
representation of China in our sourcing
mix declined 2 percentage points. At
the same time, the footwear volumes
sourced from Cambodia almost tripled
in 2010 from a low comparison base. In
2010, our footwear suppliers produced
approximately 219 million pairs of shoes
(2009: approx. 171 million pairs) see
05. The year-over-year increase was
driven by the strong sales growth in 2010
and a low comparison base in 2009 due to
inventory clean-up activities. Our largest
footwear factory produced approximately
9% of the footwear sourcing volume
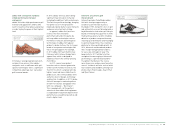
(2009: 11%). Rockport purchased
approximately 8 million pairs of footwear
in 2010, which represents an increase of
27% versus the prior year. Products were
primarily sourced from factories in China
(67%), Vietnam (25%), Indonesia (5%) and
India (3%). The largest factory accounted
for 37% of the total sourcing volume of
the Rockport brand.
Volume of apparel production increases
In 2010, we sourced 82% of the total
apparel volume for adidas, Reebok
and adidas Golf from Asia (2009: 83%).
Europe remained the second-largest
apparel sourcing region, representing
12% of the volume (2009: 11%). The
Americas accounted for 6% of the volume
(2009: 6%) see 06. China was the
largest source country, representing
36% of the produced volume, followed
by Thailand with 13% and Indonesia with
13%. In total, our suppliers produced
approximately 301 million units of
apparel in 2010 (2009: approx. 239 million
units) see 07. The largest apparel
factory produced approximately 9%
of this apparel volume in 2010 (2009:
11%). In addition, Reebok-CCM Hockey
sourced around 2 million units of apparel
in 2010 (2009: approx. 2 million units).
The majority of this volume was also
produced in Asia, while small portions
were sourced from the Americas
(particularly Canada) and Europe.
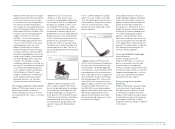
The Sports Licensed Division sourced
approximately 23 million units of apparel
and 15 million units of headwear (2009:
20 million and 14 million, respectively).
The majority of purchased apparel
products was sourced as unfinished
goods from Latin America (85%) and Asia
(15%), and was subsequently finished in
our own screen-printing facilities in the
USA. The majority of headwear sourced
was finished products manufactured
predominately in Asia (97%) and the
USA (3%).
67% of adidas and Reebok branded
hardware produced in China
In 2010, the bulk (i.e. 98%) of adidas and
Reebok branded hardware products, such
as balls and bags, was also produced in
Asia (2009: 98%). China remained our
largest source country, accounting for
67% of the sourced volume, followed
by Vietnam with 20% and Pakistan with
11%. The remaining 2% was sourced via
European countries see 08. The total
2010 hardware sourcing volume was
approximately 48 million units (2009:
approximately 34 million units), with the
largest factory accounting for 21% of
production see 09.
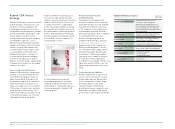
TaylorMade and Reebok-CCM Hockey
sourced 98% and 72% of their hardware
volumes from Asia, respectively (2009:
92% and 78%). In addition, both brands
sourced a portion of hardware products
in the Americas. At TaylorMade, the
majority of golf club components were
manufactured by suppliers in China and
assembled by TaylorMade in the USA,
China and Japan.