Reebok 2010 Annual Report Download - page 161
Download and view the complete annual report
Please find page 161 of the 2010 Reebok annual report below. You can navigate through the pages in the report by either clicking on the pages listed below, or by using the keyword search tool below to find specific information within the annual report.-
 1
1 -
2
-
3
-
4
-
5
-
6
-
7
-
8
-
9
-
10
-
11
-
12
-
13
-
14
-
15
-
16
-
17
-
18
-
19
-
20
-
21
-
22
-
23
-
24
-
25
-
26
-
27
-
28
-
29
-
30
-
31
-
32
-
33
-
34
-
35
-
36
-
37
-
38
-
39
-
40
-
41
-
42
-
43
-
44
-
45
-
46
-
47
-
48
-
49
-
50
-
51
-
52
-
53
-
54
-
55
-
56
-
57
-
58
-
59
-
60
-
61
-
62
-
63
-
64
-
65
-
66
-
67
-
68
-
69
-
70
-
71
-
72
-
73
-
74
-
75
-
76
-
77
-
78
-
79
-
80
-
81
-
82
-
83
-
84
-
85
-
86
-
87
-
88
-
89
-
90
-
91
-
92
-
93
-
94
-
95
-
96
-
97
-
98
-
99
-
100
-
101
-
102
-
103
-
104
-
105
-
106
-
107
-
108
-
109
-
110
-
111
-
112
-
113
-
114
-
115
-
116
-
117
-
118
-
119
-
120
-
121
-
122
-
123
-
124
-
125
-
126
-
127
-
128
-
129
-
130
-
131
-
132
-
133
-
134
-
135
-
136
-
137
-
138
-
139
-
140
-
141
-
142
-
143
-
144
-
145
-
146
-
147
-
148
-
149
-
150
-
 151
151 -
 152
152 -
 153
153 -
 154
154 -
 155
155 -
 156
156 -
 157
157 -
 158
158 -
 159
159 -
 160
160 -
 161
161 -
 162
162 -
 163
163 -
 164
164 -
 165
165 -
 166
166 -
 167
167 -
 168
168 -
 169
169 -
 170
170 -
 171
171 -
172
-
173
-
174
-
175
-
176
-
177
-
178
-
179
-
180
-
181
-
182
-
183
-
184
-
185
-
186
-
187
-
188
-
189
-
190
-
191
-
192
-
193
-
194
-
195
-
196
-
197
-
198
-
199
-
200
-
201
-
202
-
203
-
204
-
205
-
206
-
207
-
208
-
209
-
210
-
211
-
212
-
213
-
214
-
215
-
216
-
217
-
218
-
219
-
220
-
221
-
222
-
223
-
224
-
225
-
226
-
227
-
228
-
229
-
230
-
231
-
232
-
233
-
234
-
235
-
236
-
237
-
238
-
239
-
240
-
241
-
242
-
243
-
244
-
245
-
246
-
247
-
248
 |
 |
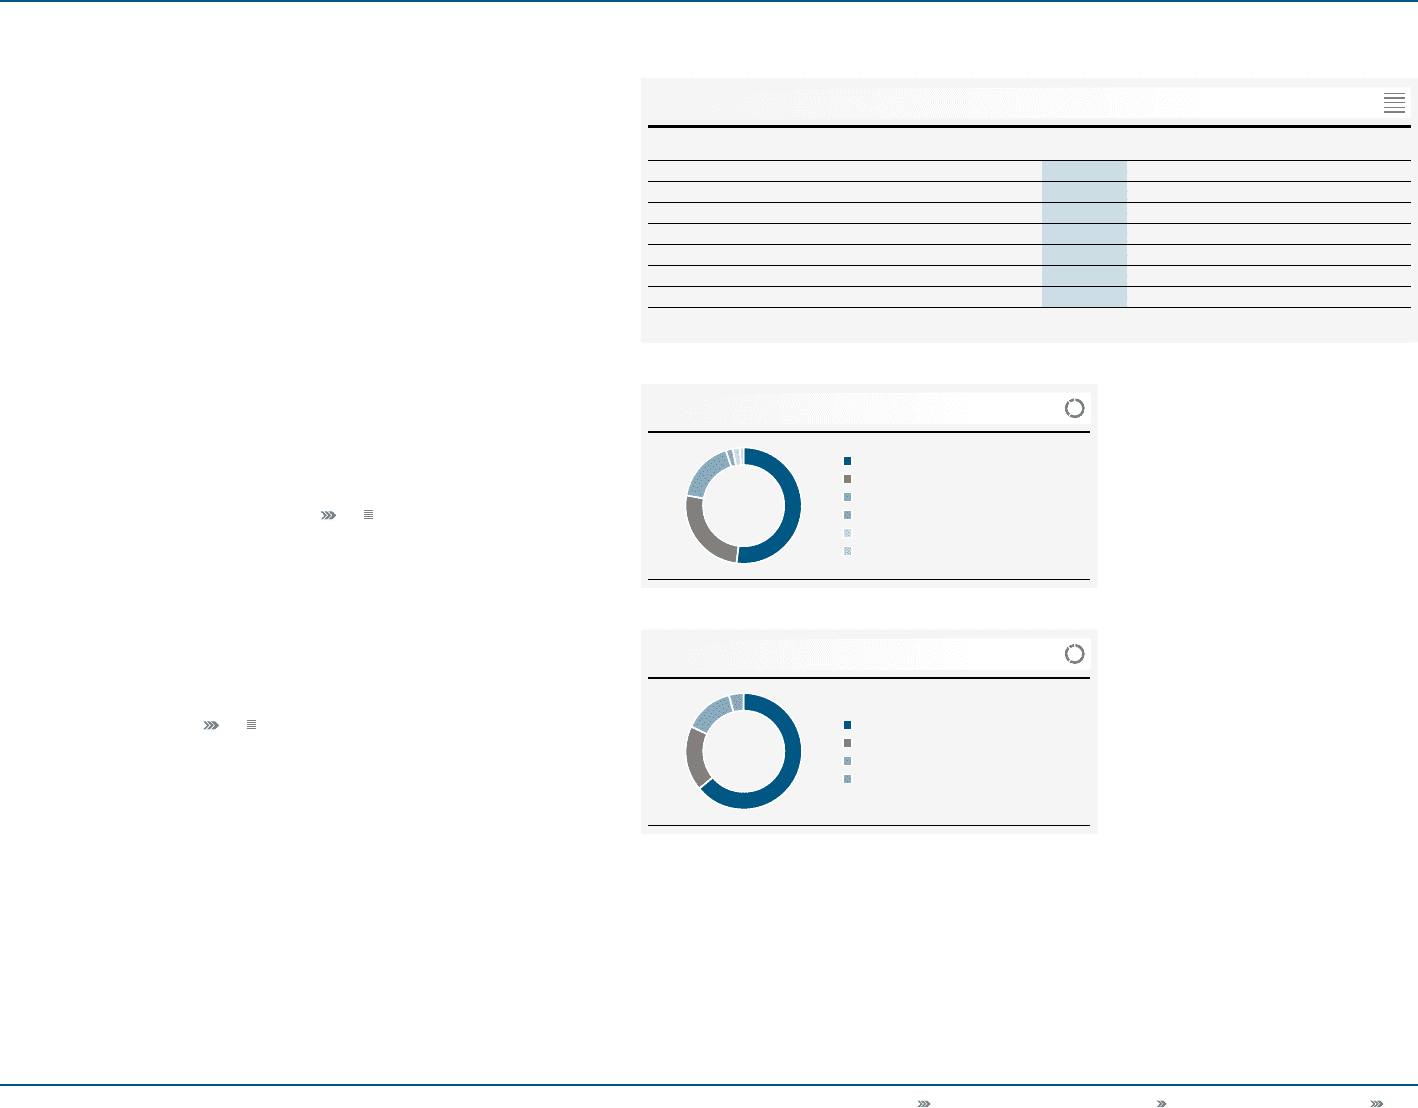
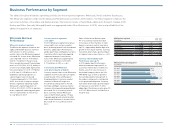
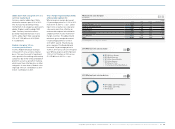
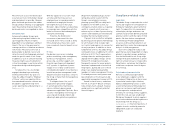
Group Management Report – Financial Review Business Performance by Segment Other Businesses Performance 157
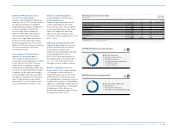
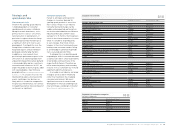
2010 Other Businesses net sales by region
2010 Other Businesses sales by brand
21
22
52% North America
26% Other Asian Markets
17% Western Europe
2% European Emerging Markets
2% Greater China
1% Latin America
64% TaylorMade-adidas Golf
18% Rockport
14% Reebok-CCM Hockey
4% Other Centrally Managed Brands
Other Businesses net sales by region
€ in millions
2010 2009 Change Change
currency-neutral
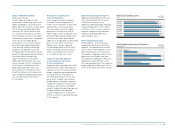
Western Europe 235 224 5% 1%
European Emerging Markets 35 30 17% 8%
North America 735 685 7% 0%
Greater China 29 24 18% 12%
Other Asian Markets 372 319 17% 3%
Latin America 14 12 16% 10%
Total 1 ) 1,420 1,293 10% 2%
1) Rounding differences may arise in totals.
20
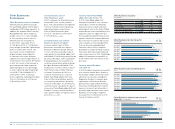
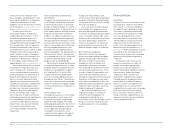
Reebok-CCM Hockey sales up 3%
on a currency-neutral basis
Currency-neutral Reebok-CCM Hockey
sales grew 3% in 2010. This development
was driven by increases in hardware
supported by new product introductions
such as the Reebok 11K and CCM
U+ Crazy Light skates. Regionally,
Reebok-CCM Hockey sales grew at a
mid-single-digit rate in Scandinavia
and at a low-single-digit rate in North
America. Currency translation effects
positively impacted sales in euro terms.
Reebok-CCM Hockey revenues increased
13% to € 200 million in 2010 from
€ 177 million in 2009.
Gross margin of Other Businesses
improves 4.2 percentage points
Gross margin of Other Businesses
increased 4.2 percentage points to 43.5%
in 2010 from 39.3% in 2009. This was
mainly due to a strong gross margin
improvement at TaylorMade-adidas Golf
as a result of improving product margins.
In addition, the Rockport gross margin
increased significantly versus the prior
year due to a lower portion of clearance
sales. In absolute terms, gross profit
increased 21% to € 618 million in 2010
versus € 509 million in 2009 see 16.
Segmental operating expenses
as a percentage of sales increase
0.1 percentage points
Segmental operating expenses rose
11% to € 249 million in 2010 from
€ 225 million in 2009. This was driven
in particular by Rockport’s own-retail
expansion. Segmental operating
expenses as a percentage of sales
increased 0.1 percentage points to 17.6%
(2009: 17.4%).
Segmental operating profit up 30%
Segmental operating profit increased
30% to € 369 million in 2010 versus
€ 283 million in the prior year.
Segmental operating margin improved
4.1 percentage points to 26.0%
(2009: 21.9%), driven by increases at
TaylorMade-adidas Golf and Rockport
see 16. The improvements were
mainly due to gross margin increases.
Number of employees decreases
At year-end 2010, the Group employed
1,676 people in Other Businesses,
representing a decrease of 4% versus
1,750 employees in the previous year.
This development is primarily a result of
reorganisation initiatives at TaylorMade-
adidas Golf and Reebok-CCM Hockey. On
a full-time equivalent basis, the number
of employees in Other Businesses
decreased 5% and amounted to 1,599 at
the end of 2010 (2009: 1,676).