Reebok 2010 Annual Report Download - page 204
Download and view the complete annual report
Please find page 204 of the 2010 Reebok annual report below. You can navigate through the pages in the report by either clicking on the pages listed below, or by using the keyword search tool below to find specific information within the annual report.-
 1
1 -
2
-
3
-
4
-
5
-
6
-
7
-
8
-
9
-
10
-
11
-
12
-
13
-
14
-
15
-
16
-
17
-
18
-
19
-
20
-
21
-
22
-
23
-
24
-
25
-
26
-
27
-
28
-
29
-
30
-
31
-
32
-
33
-
34
-
35
-
36
-
37
-
38
-
39
-
40
-
41
-
42
-
43
-
44
-
45
-
46
-
47
-
48
-
49
-
50
-
51
-
52
-
53
-
54
-
55
-
56
-
57
-
58
-
59
-
60
-
61
-
62
-
63
-
64
-
65
-
66
-
67
-
68
-
69
-
70
-
71
-
72
-
73
-
74
-
75
-
76
-
77
-
78
-
79
-
80
-
81
-
82
-
83
-
84
-
85
-
86
-
87
-
88
-
89
-
90
-
91
-
92
-
93
-
94
-
95
-
96
-
97
-
98
-
99
-
100
-
101
-
102
-
103
-
104
-
105
-
106
-
107
-
108
-
109
-
110
-
111
-
112
-
113
-
114
-
115
-
116
-
117
-
118
-
119
-
120
-
121
-
122
-
123
-
124
-
125
-
126
-
127
-
128
-
129
-
130
-
131
-
132
-
133
-
134
-
135
-
136
-
137
-
138
-
139
-
140
-
141
-
142
-
143
-
144
-
145
-
146
-
147
-
148
-
149
-
150
-
151
-
152
-
153
-
154
-
155
-
156
-
157
-
158
-
159
-
160
-
161
-
162
-
163
-
164
-
165
-
166
-
167
-
168
-
169
-
170
-
171
-
172
-
173
-
174
-
175
-
176
-
177
-
178
-
179
-
180
-
181
-
182
-
183
-
184
-
185
-
186
-
187
-
188
-
189
-
190
-
191
-
192
-
193
-
 194
194 -
 195
195 -
 196
196 -
 197
197 -
 198
198 -
 199
199 -
 200
200 -
 201
201 -
 202
202 -
 203
203 -
 204
204 -
 205
205 -
 206
206 -
 207
207 -
 208
208 -
 209
209 -
 210
210 -
 211
211 -
 212
212 -
 213
213 -
 214
214 -
215
-
216
-
217
-
218
-
219
-
220
-
221
-
222
-
223
-
224
-
225
-
226
-
227
-
228
-
229
-
230
-
231
-
232
-
233
-
234
-
235
-
236
-
237
-
238
-
239
-
240
-
241
-
242
-
243
-
244
-
245
-
246
-
247
-
248
 |
 |
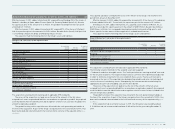
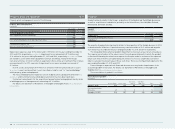
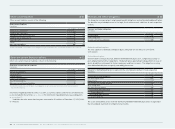
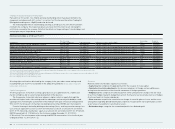
200 Consolidated Financial Statements Notes Notes to the Consolidated Statement of Financial Position
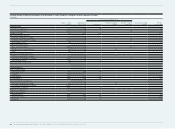
Other non-current assets 16
Other non-current assets consist of the following:
Other non-current assets
€ in millions
Dec. 31, 2010 Dec. 31, 2009
Prepaid expenses 98 117
Sundry 2 9
Other non-current assets 100 126
Prepaid expenses mainly include prepayments for long-term promotional contracts and service
contracts see also Note 37 and Note 27.
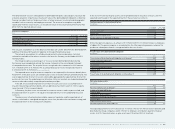
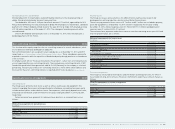
Borrowings and credit lines 17
Borrowings are denominated in a variety of currencies in which the Group conducts its business.
The largest portions of effective gross borrowings (before liquidity swaps for cash management
purposes) as at December 31, 2010 are denominated in euros (2010: 55%; 2009: 61%) and
US dollars (2010: 40%; 2009: 33%).
The weighted average interest rate on the Group’s gross borrowings remained stable at 5.1%
in 2010 (2009: 5.2%).
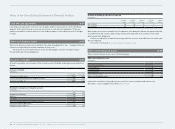
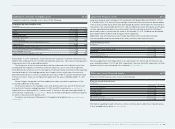
As at December 31, 2010, the Group had cash credit lines and other long-term financing
arrangements totalling € 5.5 billion (2009: € 5.9 billion); thereof unused credit lines accounted
for € 3.9 billion (2009: € 4.1 billion). In addition, the Group had separate lines for the issuance of
letters of credit and guarantees in an amount of approximately € 0.3 billion (2009: € 0.4 billion).
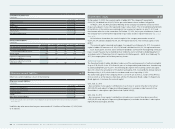
The Group’s outstanding financings are unsecured and may include standard financial
covenants, which are reviewed on a quarterly basis. These covenants may include limits on the
disposal of fixed assets, the maximum amount of debt secured by liens, cross default provisions
and change of control. In addition, certain financial arrangements contain equity ratio covenants,
minimum equity covenants as well as net loss covenants.
As of December 31, 2010, and December 31, 2009, actual shareholders’ equity was well above
the amount of the minimum equity covenant. Likewise, the relevant amount of net income clearly
exceeded net loss covenants.
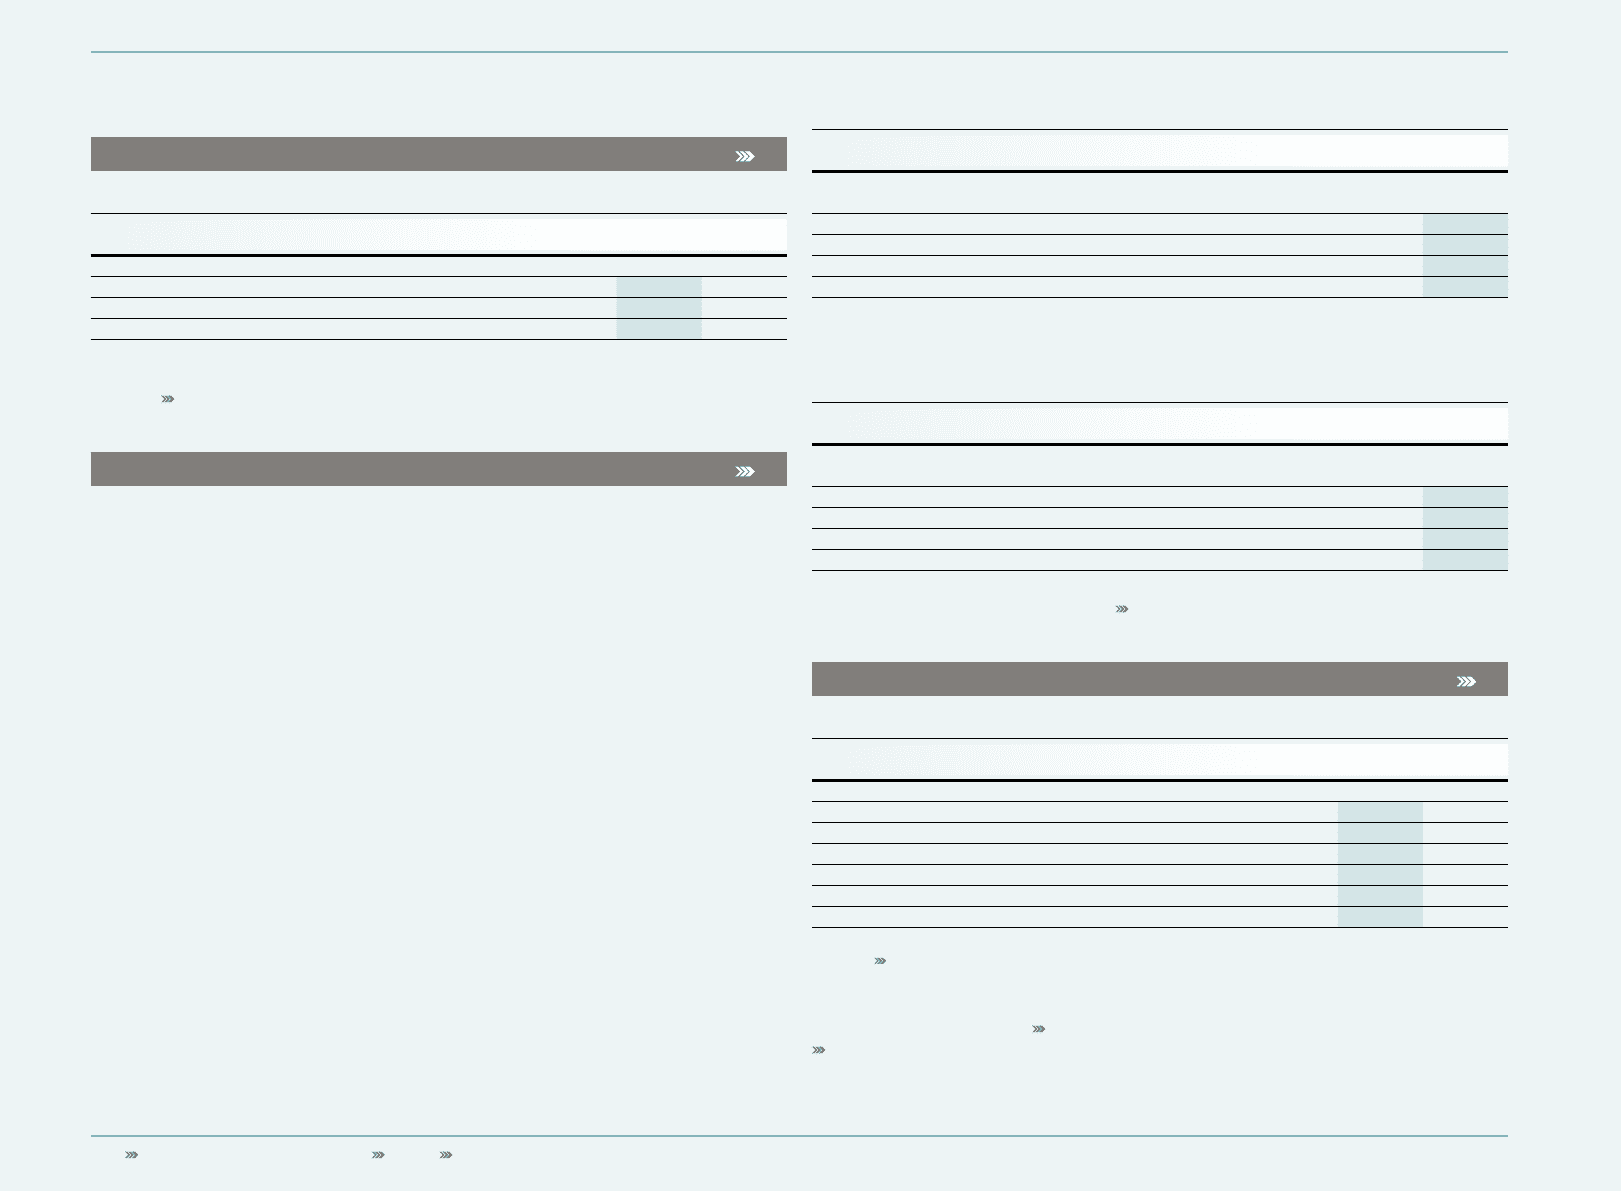
The amounts disclosed as borrowings represent outstanding borrowings under the following
arrangements with aggregated expiration dates as follows:
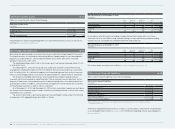
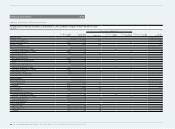
Gross borrowings as at December 31, 2010
€ in millions
Up to
1 year Between1
and 3 years Between 3
and 5 years After
5 years Total
Bank borrowings — 95 — — 95
Private placements 273 419 213 112 1,017
Eurobond — — 498 — 498
Total 273 514 711 112 1,610
In accordance with the long-term funding strategy, the bank borrowings with short-term
maturities are also classified as long-term borrowings as they represent permanent funding
volumes that are covered by the committed mid-term syndicated loan.
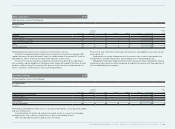
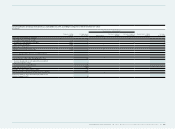
Gross borrowings as at December 31, 2009
€ in millions
Up to
1 year Between1
and 3 years Between 3
and 5 years After
5 years Total
Bank borrowings — 103 — — 103
Private placements 198 458 324 186 1,166
Eurobond — — 498 — 498
Total 198 561 822 186 1,767
For further details on future cash outflows see Risk and Opportunity Report, p. 158.
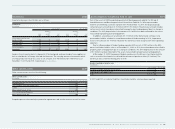
Other current financial liabilities 18
Other current financial liabilities consist of the following:
Other current financial liabilities
€ in millions
Dec. 31, 2010 Dec. 31, 2009
Interest rate derivatives 1 2
Currency options 10 10
Forward contracts 85 69
Finance lease obligations 1) 2 —
Other financial liabilities 25 20
Other current financial liabilities 123 101
1) From 2010 onwards, current finance lease obligations are presented under other current financial liabilities.
For 2009 see Note 21.
Information regarding forward contracts as well as currency options and interest rate derivatives
is also included in these Notes see Note 28. For information regarding finance lease obligations
see also Note 27.