Reebok 2010 Annual Report Download - page 17
Download and view the complete annual report
Please find page 17 of the 2010 Reebok annual report below. You can navigate through the pages in the report by either clicking on the pages listed below, or by using the keyword search tool below to find specific information within the annual report.-
 1
1 -
2
-
3
-
4
-
5
-
6
-
 7
7 -
 8
8 -
 9
9 -
 10
10 -
 11
11 -
 12
12 -
 13
13 -
 14
14 -
 15
15 -
 16
16 -
 17
17 -
 18
18 -
 19
19 -
 20
20 -
 21
21 -
 22
22 -
 23
23 -
 24
24 -
 25
25 -
 26
26 -
 27
27 -
28
-
29
-
30
-
31
-
32
-
33
-
34
-
35
-
36
-
37
-
38
-
39
-
40
-
41
-
42
-
43
-
44
-
45
-
46
-
47
-
48
-
49
-
50
-
51
-
52
-
53
-
54
-
55
-
56
-
57
-
58
-
59
-
60
-
61
-
62
-
63
-
64
-
65
-
66
-
67
-
68
-
69
-
70
-
71
-
72
-
73
-
74
-
75
-
76
-
77
-
78
-
79
-
80
-
81
-
82
-
83
-
84
-
85
-
86
-
87
-
88
-
89
-
90
-
91
-
92
-
93
-
94
-
95
-
96
-
97
-
98
-
99
-
100
-
101
-
102
-
103
-
104
-
105
-
106
-
107
-
108
-
109
-
110
-
111
-
112
-
113
-
114
-
115
-
116
-
117
-
118
-
119
-
120
-
121
-
122
-
123
-
124
-
125
-
126
-
127
-
128
-
129
-
130
-
131
-
132
-
133
-
134
-
135
-
136
-
137
-
138
-
139
-
140
-
141
-
142
-
143
-
144
-
145
-
146
-
147
-
148
-
149
-
150
-
151
-
152
-
153
-
154
-
155
-
156
-
157
-
158
-
159
-
160
-
161
-
162
-
163
-
164
-
165
-
166
-
167
-
168
-
169
-
170
-
171
-
172
-
173
-
174
-
175
-
176
-
177
-
178
-
179
-
180
-
181
-
182
-
183
-
184
-
185
-
186
-
187
-
188
-
189
-
190
-
191
-
192
-
193
-
194
-
195
-
196
-
197
-
198
-
199
-
200
-
201
-
202
-
203
-
204
-
205
-
206
-
207
-
208
-
209
-
210
-
211
-
212
-
213
-
214
-
215
-
216
-
217
-
218
-
219
-
220
-
221
-
222
-
223
-
224
-
225
-
226
-
227
-
228
-
229
-
230
-
231
-
232
-
233
-
234
-
235
-
236
-
237
-
238
-
239
-
240
-
241
-
242
-
243
-
244
-
245
-
246
-
247
-
248
 |
 |

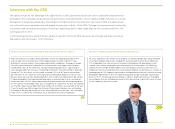
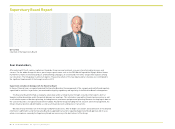
To Our Shareholders Interview with the CEO 13
In November, you revealed your strategic plan for the next five years called Route 2015. In November, you revealed your strategic plan for the next five years called Route 2015.
What is the rationale behind the plan, and can you share with us the key aspirations it What is the rationale behind the plan, and can you share with us the key aspirations it
contains?contains?
Rising input costs and price inflation are currently two widely discussed topics in the Rising input costs and price inflation are currently two widely discussed topics in the
financial markets. Do you foresee major impacts on gross margin from these risks?financial markets. Do you foresee major impacts on gross margin from these risks?
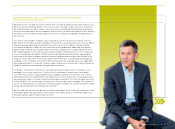
When we are focused, we are a formidable competitor to any brand that may choose to
compete with us – and it is with this attitude and rationale that we have established Route
2015. It is the most comprehensive and aligned strategic business plan this Group has
ever created and is based on our long-term mission to be the global leader in the sporting
goods industry. This strategy starts and ends with the consumer.
Our key aspiration in the plan is to outperform total market growth, both GDP and sporting
goods market, as well as our major competitors. Because, it is only by sustaining quality
growth that we will be able to unleash the incredible value we all know our Group can
create. We aim to achieve high-single-digit currency-neutral sales growth annually over the
five-year period, which represents a 45% to 50% revenue increase from 2010 levels. From a
brand perspective, adidas and Reebok will account for more than 90% of the increase, with
the rest coming from our Other Businesses. Our three key attack markets North America,
Greater China and Russia/CIS are targeted to deliver 50% of the growth. In terms of earnings
per share, which will be the litmus test of our ability to create value, we intend to achieve
a compound annual growth rate of 15% over the five years. This will be achieved through
balancing the investment required to secure top-line growth, and leveraging this through to
the bottom line. As part of this goal, we are committed to achieving an 11% operating margin
sustainably at the latest by 2015.
There is absolutely no denying that the growth in sales and earnings which we are outlining
will yield unprecedented levels of cash flow for our Group over the next five years. And, I am
sure you will agree that this is how value should be created.
These market forces are not just topical, but headwinds we, and indeed everyone in our
industry, must face. Let’s look at the facts. Raw material, labour and transportation costs
have all gone up – some quite excessively. Take cotton as an example. Prices almost doubled
last year, and are still rising sharply, up over 20% already in 2011. To mitigate these negative
developments, our Global Brands and Global Operations functions are working hard on
optimising our product creation, manufacturing and distribution processes to bring our
products to market more cost-efficiently. These efforts will provide us with some relief.
However, with the extreme raw material price increases towards the end of last year, they will
not be enough to fully offset the entirety of the cost pressures. Therefore, pricing and thus
inflation in our industry is an economic reality. When it comes to pricing power, we can be very
confident. Even in the midst of the worst global recession in living memory, we have seen that
consumers will pay a premium for exciting, new products from brands renowned for quality,
innovation and service. We have those brands and those products. And, we have the marketing
prowess to support them and to further increase their desirability. Ultimately, the consumer
will decide and we will watch carefully how price and volumes develop over the year.
Obviously, for our financial results, the most impacted metric will be our gross margin. While
the above factors may end up being a negative, nevertheless, there are also other factors that
will play in our favour in 2011. These include regional mix, as we expect to grow faster in the
emerging markets, and also the increasing portion of higher-margin own-retail sales. As a
result, we expect Group gross margin to remain largely unchanged in 2011, in the range from
47.5% to 48.0% compared to 47.8% in 2010. However, if input costs continue to rise at such a
pace, then the challenge will undoubtedly intensify and lead to further margin pressure for our
industry beyond 2011.