Reebok 2010 Annual Report Download - page 151
Download and view the complete annual report
Please find page 151 of the 2010 Reebok annual report below. You can navigate through the pages in the report by either clicking on the pages listed below, or by using the keyword search tool below to find specific information within the annual report.-
 1
1 -
2
-
3
-
4
-
5
-
6
-
7
-
8
-
9
-
10
-
11
-
12
-
13
-
14
-
15
-
16
-
17
-
18
-
19
-
20
-
21
-
22
-
23
-
24
-
25
-
26
-
27
-
28
-
29
-
30
-
31
-
32
-
33
-
34
-
35
-
36
-
37
-
38
-
39
-
40
-
41
-
42
-
43
-
44
-
45
-
46
-
47
-
48
-
49
-
50
-
51
-
52
-
53
-
54
-
55
-
56
-
57
-
58
-
59
-
60
-
61
-
62
-
63
-
64
-
65
-
66
-
67
-
68
-
69
-
70
-
71
-
72
-
73
-
74
-
75
-
76
-
77
-
78
-
79
-
80
-
81
-
82
-
83
-
84
-
85
-
86
-
87
-
88
-
89
-
90
-
91
-
92
-
93
-
94
-
95
-
96
-
97
-
98
-
99
-
100
-
101
-
102
-
103
-
104
-
105
-
106
-
107
-
108
-
109
-
110
-
111
-
112
-
113
-
114
-
115
-
116
-
117
-
118
-
119
-
120
-
121
-
122
-
123
-
124
-
125
-
126
-
127
-
128
-
129
-
130
-
131
-
132
-
133
-
134
-
135
-
136
-
137
-
138
-
139
-
140
-
 141
141 -
 142
142 -
 143
143 -
 144
144 -
 145
145 -
 146
146 -
 147
147 -
 148
148 -
 149
149 -
 150
150 -
 151
151 -
 152
152 -
 153
153 -
 154
154 -
 155
155 -
 156
156 -
 157
157 -
 158
158 -
 159
159 -
 160
160 -
 161
161 -
162
-
163
-
164
-
165
-
166
-
167
-
168
-
169
-
170
-
171
-
172
-
173
-
174
-
175
-
176
-
177
-
178
-
179
-
180
-
181
-
182
-
183
-
184
-
185
-
186
-
187
-
188
-
189
-
190
-
191
-
192
-
193
-
194
-
195
-
196
-
197
-
198
-
199
-
200
-
201
-
202
-
203
-
204
-
205
-
206
-
207
-
208
-
209
-
210
-
211
-
212
-
213
-
214
-
215
-
216
-
217
-
218
-
219
-
220
-
221
-
222
-
223
-
224
-
225
-
226
-
227
-
228
-
229
-
230
-
231
-
232
-
233
-
234
-
235
-
236
-
237
-
238
-
239
-
240
-
241
-
242
-
243
-
244
-
245
-
246
-
247
-
248
 |
 |
Group Management Report – Financial Review Group Business Performance Treasury 147
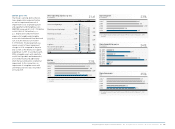
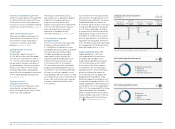
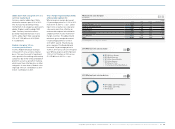
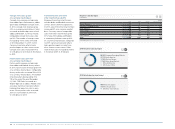
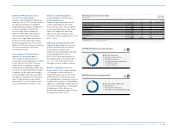
Short-term credit lines
€ in millions
2010 2009
Total 2,169 2,238
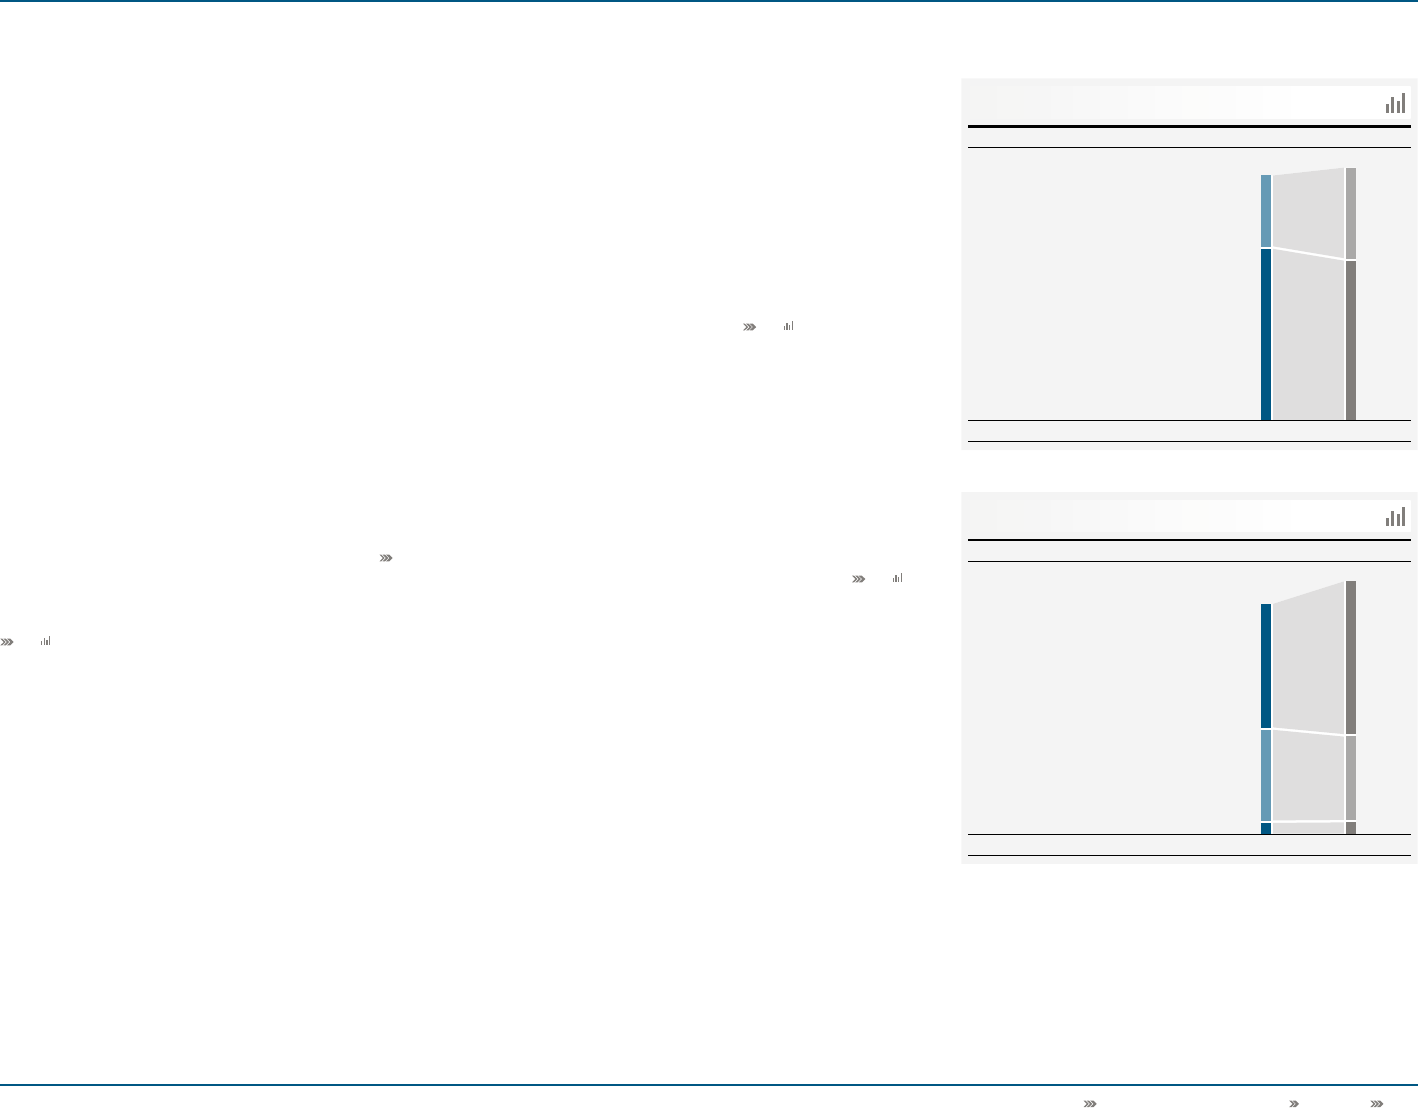
Currency split of gross borrowings
€ in millions
2010 2009
Total 1,610 1,767
45
46
Committed ........................660
EUR .............................. 879
Uncommitted . . . . . . . . . . . . . . . . . . . . . 1,509
USD .............................. 642
All others .......................... 90
828
1,076
1,410
591
100
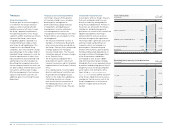
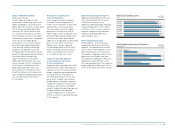
Financial flexibility ensured
The adidas Group’s financial flexibility is
ensured by unutilised credit facilities in
an amount of € 3.934 billion at the end
of 2010 (2009: € 4.135 billion). These
include a € 1.860 billion committed
multi-year syndicated loan which was not
utilised at year-end (2009: € 2.000 billion
unutilised) as well as bilateral credit
lines at different banks in an amount of
€ 2.074 billion (2009: € 2.135 billion). We
monitor the ongoing need for available
credit lines based on the current level
of debt as well as future financing
requirements.
Short-term credit lines decrease
Short-term credit lines declined 3%
to € 2.169 billion at the end of 2010
from € 2.238 billion in the prior year.
Credit lines decreased in line with
lower financing needs and growing cash
surpluses. Committed and uncommitted
credit lines represent approximately
30% and 70% of total short-term credit
lines, respectively (2009: 37% and 63%)
see 45.
Standard financial covenants
In the case of our committed credit
facilities, we have entered into various
covenants. These covenants may include
limits on the disposal of fixed assets,
the amount of debt secured by liens,
cross default provisions and change of
control. In addition, certain financial
arrangements contain equity ratio
covenants, minimum equity covenants
as well as net loss covenants. If we
failed to meet any covenant and were
unable to obtain a waiver from a majority
of partner banks, borrowings would
become due and payable immediately.
As at December 31, 2010, we were in full
compliance with all of our covenants,
with ample coverage above all stipulated
minimum requirements. As a result
of our cash flow expectations, we
are confident we will continue to be
compliant with these covenants going
forward see Subsequent Events and Outlook,
p. 174. We currently believe that cash
generated by operations, together with
access to external sources of funds, will
be sufficient to meet our future operating
and capital needs.
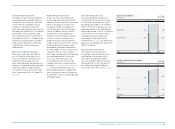
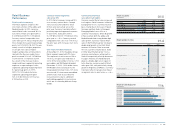
Gross borrowings decrease
Gross borrowings decreased 9% to
€ 1.610 billion at the end of 2010 from
€ 1.767 billion in the prior year. Bank
borrowings declined 8% to € 95 million
from € 103 million in the prior year. Our
private placements in the USA, Europe
and Asia decreased 13% to € 1.017 billion
in 2010 (2009: € 1.166 billion). Bonds
outstanding remained stable and
amounted to € 498 million (2009:
€ 498 million) see 43. No commercial
paper was outstanding at the end of 2010
(2009: € 0 million).
Euro dominates currency mix
The majority of our Group’s gross
borrowings are denominated in euros
and US dollars. At the end of 2010,
gross borrowings denominated in
euros accounted for 55% of total gross
borrowings (2009: 61%). The share of
gross borrowings held in US dollars
increased to 40% (2009: 33%) see 46.