Reebok 2010 Annual Report Download - page 171
Download and view the complete annual report
Please find page 171 of the 2010 Reebok annual report below. You can navigate through the pages in the report by either clicking on the pages listed below, or by using the keyword search tool below to find specific information within the annual report.-
 1
1 -
2
-
3
-
4
-
5
-
6
-
7
-
8
-
9
-
10
-
11
-
12
-
13
-
14
-
15
-
16
-
17
-
18
-
19
-
20
-
21
-
22
-
23
-
24
-
25
-
26
-
27
-
28
-
29
-
30
-
31
-
32
-
33
-
34
-
35
-
36
-
37
-
38
-
39
-
40
-
41
-
42
-
43
-
44
-
45
-
46
-
47
-
48
-
49
-
50
-
51
-
52
-
53
-
54
-
55
-
56
-
57
-
58
-
59
-
60
-
61
-
62
-
63
-
64
-
65
-
66
-
67
-
68
-
69
-
70
-
71
-
72
-
73
-
74
-
75
-
76
-
77
-
78
-
79
-
80
-
81
-
82
-
83
-
84
-
85
-
86
-
87
-
88
-
89
-
90
-
91
-
92
-
93
-
94
-
95
-
96
-
97
-
98
-
99
-
100
-
101
-
102
-
103
-
104
-
105
-
106
-
107
-
108
-
109
-
110
-
111
-
112
-
113
-
114
-
115
-
116
-
117
-
118
-
119
-
120
-
121
-
122
-
123
-
124
-
125
-
126
-
127
-
128
-
129
-
130
-
131
-
132
-
133
-
134
-
135
-
136
-
137
-
138
-
139
-
140
-
141
-
142
-
143
-
144
-
145
-
146
-
147
-
148
-
149
-
150
-
151
-
152
-
153
-
154
-
155
-
156
-
157
-
158
-
159
-
160
-
 161
161 -
 162
162 -
 163
163 -
 164
164 -
 165
165 -
 166
166 -
 167
167 -
 168
168 -
 169
169 -
 170
170 -
 171
171 -
 172
172 -
 173
173 -
 174
174 -
 175
175 -
 176
176 -
 177
177 -
 178
178 -
 179
179 -
 180
180 -
 181
181 -
182
-
183
-
184
-
185
-
186
-
187
-
188
-
189
-
190
-
191
-
192
-
193
-
194
-
195
-
196
-
197
-
198
-
199
-
200
-
201
-
202
-
203
-
204
-
205
-
206
-
207
-
208
-
209
-
210
-
211
-
212
-
213
-
214
-
215
-
216
-
217
-
218
-
219
-
220
-
221
-
222
-
223
-
224
-
225
-
226
-
227
-
228
-
229
-
230
-
231
-
232
-
233
-
234
-
235
-
236
-
237
-
238
-
239
-
240
-
241
-
242
-
243
-
244
-
245
-
246
-
247
-
248
 |
 |
Group Management Report – Financial Review Risk and Opportunity Report 167
Other activities to mitigate credit risks
include retention of title clauses as well
as, on a selective basis, credit insur-
ances, accounts receivable sales without
recourse and bank guarantees.
Objective evidence that financial
assets are impaired includes, for
instance, significant difficulty of the
issuer or debtor, indications of the
potential bankruptcy of the borrower and
the disappearance of an active market
for a financial asset because of financial
difficulties. The Group utilises allowance
accounts for impairments that represent
our estimate of incurred credit losses
with respect to accounts receivable.
Allowance accounts are used as long
as the Group is satisfied that recovery
of the amount due is possible. Once this
is no longer the case, the amounts are
considered irrecoverable and are directly
written off against the financial asset.
The allowance consists of two
components:
(1) an allowance established for all
receivables dependent on the ageing
structure of receivables past due date
and
(2) a specific allowance that relates
to individually assessed risk for each
specific customer – irrespective of
ageing.
At the end of 2010, no Group
customer accounted for more than 10%
of accounts receivable. We therefore
believe that the potential financial impact
of our credit risks from customers,
particularly smaller retailers, is
moderate and we rate the likelihood of
occurrence as possible see Economic and
Sector Development, p. 130.
The adidas Group Treasury depart-
ment arranges currency and interest
rate hedges, and invests cash, with
major banks of a high credit standing
throughout the world. adidas Group
companies are authorised to work with
banks rated BBB+ or higher.
Only in exceptional cases are
subsidiaries authorised to work with
banks rated lower than BBB+. To limit
risk in these cases, restrictions are
clearly stipulated, such as maximum
cash deposit levels. In addition, the credit
default swap premiums of our partner
banks are monitored on a weekly basis.
In the event that the defined threshold is
exceeded, credit balances are shifted to
banks compliant with the limit. During
2010, the credit default swap premiums
for many banks further declined
from their highs in the aftermath of
the financial turmoil in 2008. This
development indicates a slight decrease
of the associated risks.
Although financial market conditions
improved in 2010, we continue to
believe that the potential financial
impact of credit risks from these assets
is moderate and the likelihood of
occurrence is possible. Nevertheless,
we believe our risk concentration is
limited due to the broad distribution
of our investment business with more
than 24 banks. At December 31, 2010,
no bank accounted for more than 8% of
our investment business and the average
concentration, including subsidiaries’
short-term deposits in local banks, was
1%. This leads to a maximum exposure
of € 105 million in the event of default of
any single bank.
Furthermore, we held derivatives with a
positive fair market value in the amount
of € 86 million. The maximum exposure
to any single bank resulting from these
assets amounted to € 8 million and the
average concentration was 1%.
Financing and liquidity risks
Liquidity risks arise from not having
the necessary resources available to
meet maturing liabilities with regard to
timing, volume and currency structure.
In addition, the adidas Group faces the
risk of having to accept unfavourable
financing terms due to liquidity
restraints. Our Group’s Treasury
department uses an efficient cash
management system to manage liquidity
risk. At December 31, 2010, Group
cash and cash equivalents amounted
to € 1.16 billion (2009: € 775 million).
Moreover, our Group maintains
€ 2.17 billion bilateral short-term credit
lines and a € 1.86 billion committed
medium-term syndicated loan facility
with international banks, which does not
include a market disruption clause. The
€ 4.03 billion in credit lines are designed
to ensure sufficient liquidity at all times
see Treasury, p. 146.
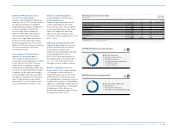
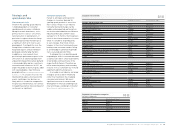
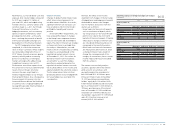
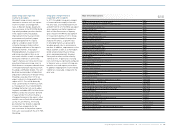
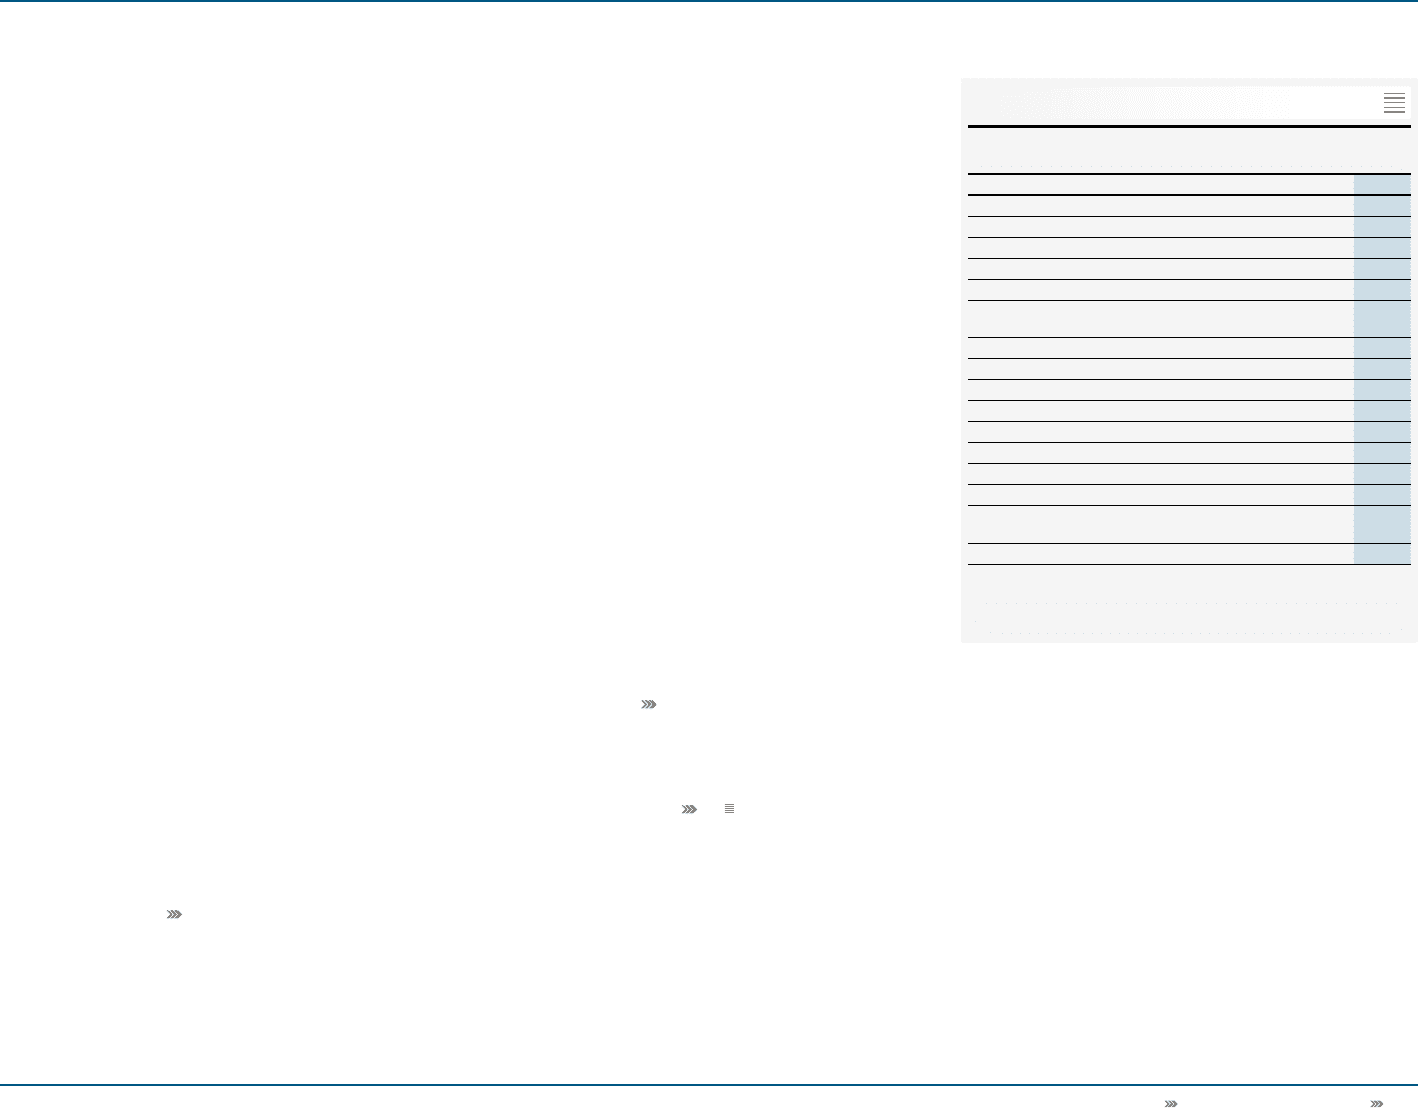
Future cash outflows arising from
financial liabilities that are recognised
in
the Consolidated Statement of Financial
Position are presented in the adjacent
table
see 04.
Future cash outflows 1 )
€ in millions
Up to 1
year
Between
1 and 3
years
Between
3 and 5
years
After
5 years Total
As at December 31, 2010
Bank borrowings 2 ) 95 — — — 95
Private placements 3 ) 320 482 237 118 1,157
Eurobond 3 ) 24 48 514 — 586
Accounts payable 1,694 — — — 1,694
Other financial liabilities 27 2 1 — 30
Derivative financial
liabilities 96 12 0 0 108
Total 2,256 544 752 118 3,670
As at December 31, 2009
Bank borrowings 2 ) 103 — — — 103
Private placements 3 ) 245 537 370 201 1,353
Eurobond 3 ) 24 48 538 — 610
Accounts payable 1,166 — — — 1,166
Other financial liabilities 21 0 1 1 23
Derivative financial
liabilities 81 23 1 1 106
Total 1,640 609 909 203 3,361
1) Rounding differences may arise in totals.
2) Classified as long-term (between 1 and 3 years) in the consolidated financial
statements, as they are covered by the committed mid-term syndicated loan.
3) Including interest payments.
04