Reebok 2010 Annual Report Download - page 224
Download and view the complete annual report
Please find page 224 of the 2010 Reebok annual report below. You can navigate through the pages in the report by either clicking on the pages listed below, or by using the keyword search tool below to find specific information within the annual report.-
 1
1 -
2
-
3
-
4
-
5
-
6
-
7
-
8
-
9
-
10
-
11
-
12
-
13
-
14
-
15
-
16
-
17
-
18
-
19
-
20
-
21
-
22
-
23
-
24
-
25
-
26
-
27
-
28
-
29
-
30
-
31
-
32
-
33
-
34
-
35
-
36
-
37
-
38
-
39
-
40
-
41
-
42
-
43
-
44
-
45
-
46
-
47
-
48
-
49
-
50
-
51
-
52
-
53
-
54
-
55
-
56
-
57
-
58
-
59
-
60
-
61
-
62
-
63
-
64
-
65
-
66
-
67
-
68
-
69
-
70
-
71
-
72
-
73
-
74
-
75
-
76
-
77
-
78
-
79
-
80
-
81
-
82
-
83
-
84
-
85
-
86
-
87
-
88
-
89
-
90
-
91
-
92
-
93
-
94
-
95
-
96
-
97
-
98
-
99
-
100
-
101
-
102
-
103
-
104
-
105
-
106
-
107
-
108
-
109
-
110
-
111
-
112
-
113
-
114
-
115
-
116
-
117
-
118
-
119
-
120
-
121
-
122
-
123
-
124
-
125
-
126
-
127
-
128
-
129
-
130
-
131
-
132
-
133
-
134
-
135
-
136
-
137
-
138
-
139
-
140
-
141
-
142
-
143
-
144
-
145
-
146
-
147
-
148
-
149
-
150
-
151
-
152
-
153
-
154
-
155
-
156
-
157
-
158
-
159
-
160
-
161
-
162
-
163
-
164
-
165
-
166
-
167
-
168
-
169
-
170
-
171
-
172
-
173
-
174
-
175
-
176
-
177
-
178
-
179
-
180
-
181
-
182
-
183
-
184
-
185
-
186
-
187
-
188
-
189
-
190
-
191
-
192
-
193
-
194
-
195
-
196
-
197
-
198
-
199
-
200
-
201
-
202
-
203
-
204
-
205
-
206
-
207
-
208
-
209
-
210
-
211
-
212
-
213
-
 214
214 -
 215
215 -
 216
216 -
 217
217 -
 218
218 -
 219
219 -
 220
220 -
 221
221 -
 222
222 -
 223
223 -
 224
224 -
 225
225 -
 226
226 -
 227
227 -
 228
228 -
 229
229 -
 230
230 -
 231
231 -
 232
232 -
 233
233 -
 234
234 -
235
-
236
-
237
-
238
-
239
-
240
-
241
-
242
-
243
-
244
-
245
-
246
-
247
-
248
 |
 |
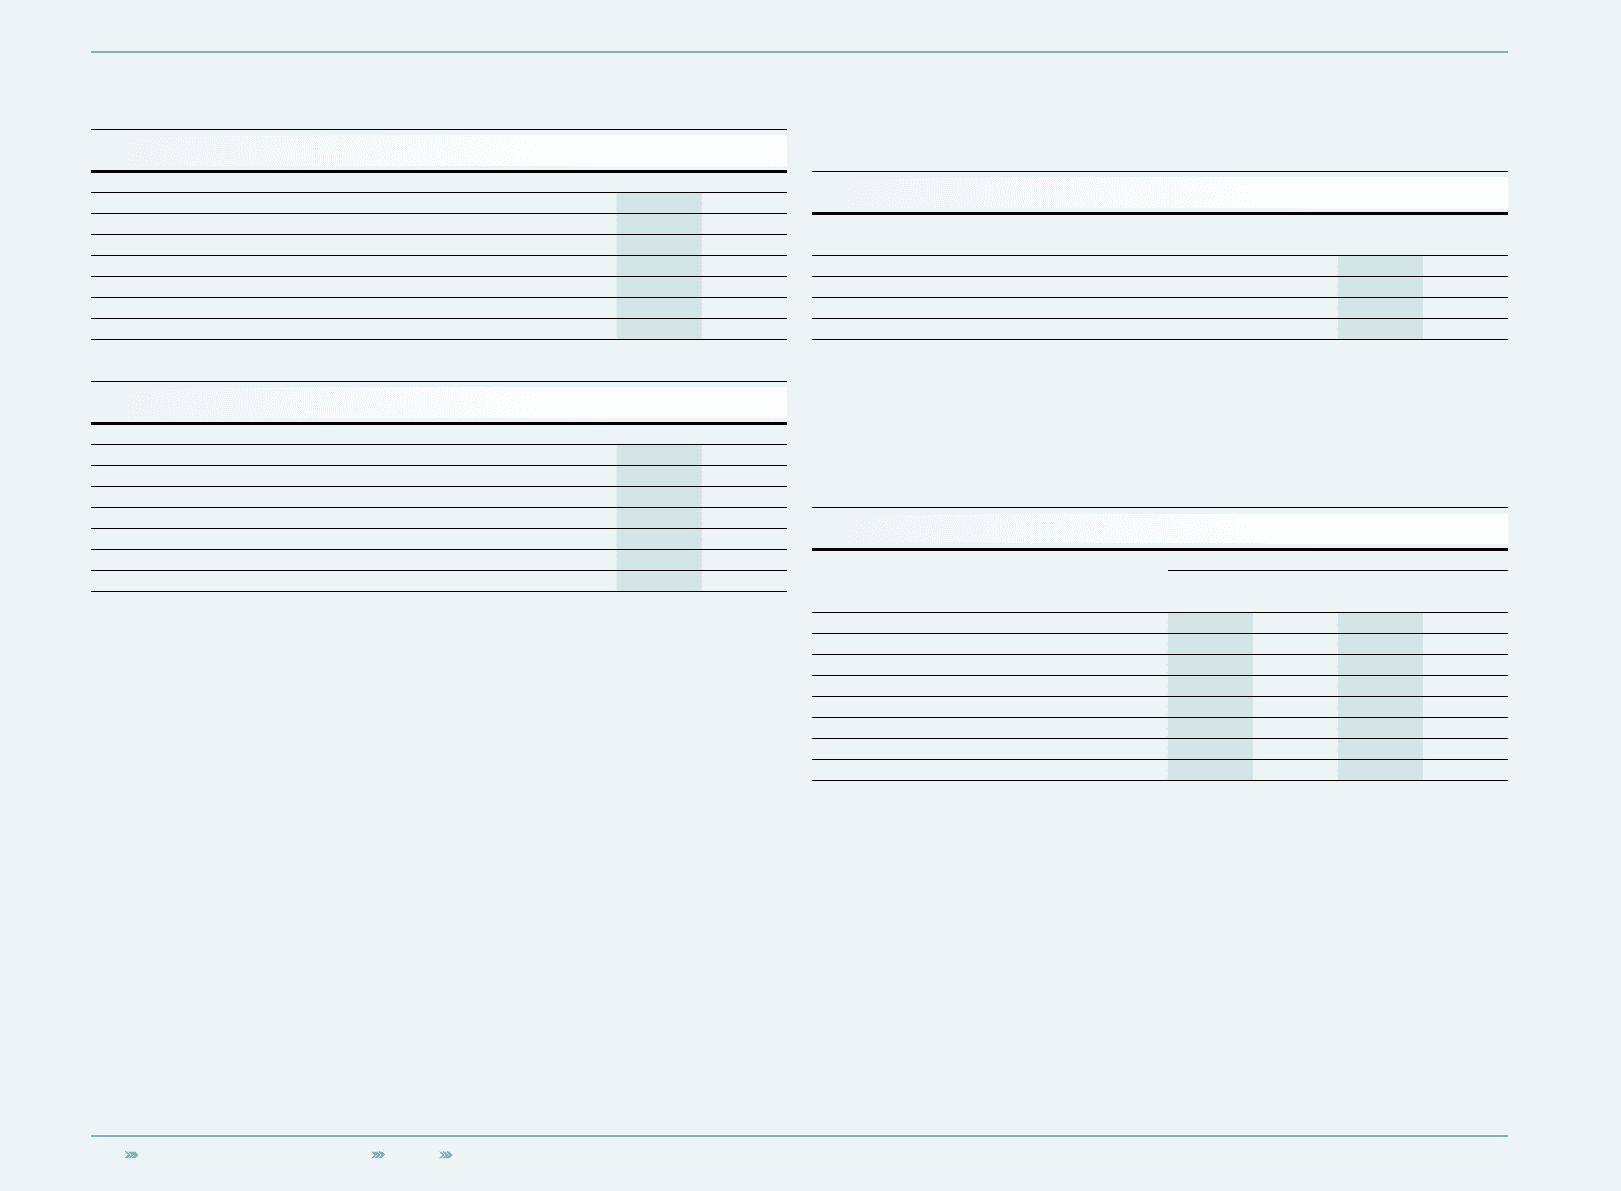
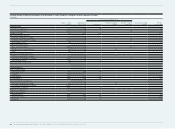
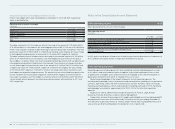
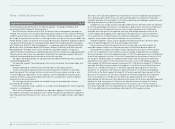
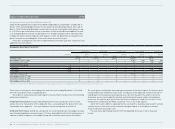
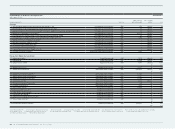
220 Consolidated Financial Statements Notes Notes – Additional Information
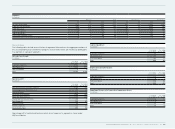
Total assets
€ in millions
Dec. 31, 2010 Dec. 31, 2009
Assets of reportable segments 3,231 2,367
Assets of other businesses 514 420
Non-segmental accounts receivable and inventories 41 113
Current financial assets 1,586 1,010
Other current assets 508 575
Non-current assets 4,738 4,390
Total assets 10,618 8,875
Total liabilities
€ in millions
Dec. 31, 2010 Dec. 31, 2009
Liabilities of reportable segments 613 507
Liabilities of other businesses 110 78
Non-segmental accounts payable 971 581
Current financial liabilities 396 299
Other current liabilities 1,818 1,371
Non-current liabilities 2,087 2,263
Total liabilities 5,995 5,099
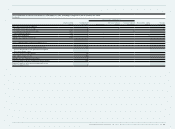
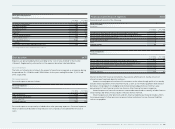
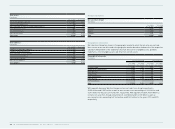
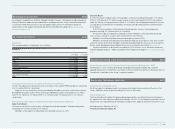
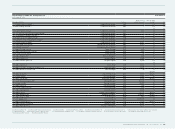
Product informationProduct information
Net sales (non-Group)
€ in millions
Year ending
Dec. 31, 2010 Year ending
Dec. 31, 2009
Footwear 5,389 4,642
Apparel 5,380 4,663
Hardware 1,221 1,076
Total 11,990 10,381
Geographical informationGeographical information
Net sales (non-Group) are shown in the geographic market in which the net sales are realised.
Non-current assets are allocated to the geographic market based on the domicile of the respective
subsidiary independent of the segmental structure and consist of tangible assets, goodwill,
trademarks, other intangible assets and other non-current assets.
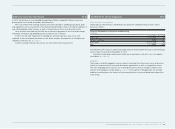
Geographical information
€ in millions
Net sales (non-Group) Non-current assets
Year ending
Dec. 31, 2010 Year ending
Dec. 31, 2009 Year ending
Dec. 31, 2010 Year ending
Dec. 31, 2009
Western Europe 3,543 3,261 1,515 1,505
European Emerging Markets 1,385 1,122 592 437
North America 2,805 2,362 683 666
Greater China 1,000 967 520 474
Other Asian Markets 1,972 1,647 557 521
Latin America 1,285 1,006 216 225
HQ/Consolidation 0 16 0 0
Total 11,990 10,381 4,083 3,828
With regard to Germany, Western Europe contains net sales (non-Group) amounting to
€ 655 million and € 587 million as well as non-current assets amounting to € 363 million and
€ 281 million for the years 2010 and 2009, respectively. With regard to the USA, North America
contains net sales (non-Group) amounting to € 2.427 billion and € 2.068 billion as well as
non-current assets amounting to € 546 million and € 547 million for the years 2010 and 2009,
respectively.