Reebok 2010 Annual Report Download - page 167
Download and view the complete annual report
Please find page 167 of the 2010 Reebok annual report below. You can navigate through the pages in the report by either clicking on the pages listed below, or by using the keyword search tool below to find specific information within the annual report.-
 1
1 -
2
-
3
-
4
-
5
-
6
-
7
-
8
-
9
-
10
-
11
-
12
-
13
-
14
-
15
-
16
-
17
-
18
-
19
-
20
-
21
-
22
-
23
-
24
-
25
-
26
-
27
-
28
-
29
-
30
-
31
-
32
-
33
-
34
-
35
-
36
-
37
-
38
-
39
-
40
-
41
-
42
-
43
-
44
-
45
-
46
-
47
-
48
-
49
-
50
-
51
-
52
-
53
-
54
-
55
-
56
-
57
-
58
-
59
-
60
-
61
-
62
-
63
-
64
-
65
-
66
-
67
-
68
-
69
-
70
-
71
-
72
-
73
-
74
-
75
-
76
-
77
-
78
-
79
-
80
-
81
-
82
-
83
-
84
-
85
-
86
-
87
-
88
-
89
-
90
-
91
-
92
-
93
-
94
-
95
-
96
-
97
-
98
-
99
-
100
-
101
-
102
-
103
-
104
-
105
-
106
-
107
-
108
-
109
-
110
-
111
-
112
-
113
-
114
-
115
-
116
-
117
-
118
-
119
-
120
-
121
-
122
-
123
-
124
-
125
-
126
-
127
-
128
-
129
-
130
-
131
-
132
-
133
-
134
-
135
-
136
-
137
-
138
-
139
-
140
-
141
-
142
-
143
-
144
-
145
-
146
-
147
-
148
-
149
-
150
-
151
-
152
-
153
-
154
-
155
-
156
-
 157
157 -
 158
158 -
 159
159 -
 160
160 -
 161
161 -
 162
162 -
 163
163 -
 164
164 -
 165
165 -
 166
166 -
 167
167 -
 168
168 -
 169
169 -
 170
170 -
 171
171 -
 172
172 -
 173
173 -
 174
174 -
 175
175 -
 176
176 -
 177
177 -
178
-
179
-
180
-
181
-
182
-
183
-
184
-
185
-
186
-
187
-
188
-
189
-
190
-
191
-
192
-
193
-
194
-
195
-
196
-
197
-
198
-
199
-
200
-
201
-
202
-
203
-
204
-
205
-
206
-
207
-
208
-
209
-
210
-
211
-
212
-
213
-
214
-
215
-
216
-
217
-
218
-
219
-
220
-
221
-
222
-
223
-
224
-
225
-
226
-
227
-
228
-
229
-
230
-
231
-
232
-
233
-
234
-
235
-
236
-
237
-
238
-
239
-
240
-
241
-
242
-
243
-
244
-
245
-
246
-
247
-
248
 |
 |

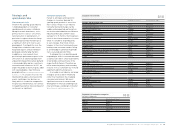
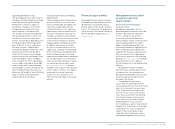
Group Management Report – Financial Review Risk and Opportunity Report 163
The Group reduces this risk by only
entering into lease contracts with
durations of less than ten years.
Store performance is measured by
a retail scorecard consisting of nine
quantitative key performance indicators.
Underperforming stores are reorganised,
remodelled or closed as appropriate.
Our increased focus on improving our
sophistication as a retailer by investing
in management expertise as well as in IT
systems remains a key priority for 2011
see Global Sales Strategy, p. 82. Despite
the projected improvement in the global
macroeconomic environment in 2011,
risks to consumer spending due to rising
inflation are high see Economic and Sector
Development, p. 130. Therefore, we view the
risk of underperformance of some of our
own-retail stores as likely. The potential
financial impact from own-retail under-
performance, which may also involve
impairment charges and store closures,
is moderate.
Risks from rising input costs
Raw material and labour costs account
for approximately 70% of the Group’s
cost of sales. Prices of materials such
as rubber, cotton, polyester and those
which closely correlate with the oil price
are especially subject to the risk of
price changes. As our ordering process
and price negotiations usually take
place around six months in advance of
production, our sourcing function has
visibility and reaction time to plan for
sharp increases in input costs.
To reduce the financial impact on our
product margins from higher sourcing
costs, we are implementing further lean
manufacturing techniques at our partner
factories, reducing time and cost in the
procurement process, re-engineering
our products and selectively increasing
prices where possible. In addition, within
our end-to-end profitability initiatives,
we have implemented a dedicated team
which is responsible for elaborating
mitigation measures against rising input
costs throughout the supply chain see
Global Operations, p. 106. In the medium
term, we also have the ability to adapt
our sourcing structure to take advantage
of more competitive pricing in other
locations.
As a result of the considerable
turnaround in global economic activity,
raw material prices have increased
significantly compared to the prior
year. This development is forecasted to
negatively impact our sourcing costs in
2011. As we begin planning for 2012,
further increases cannot be ruled out.
Therefore, the risks from rising input
costs have increased significantly
compared to the end of 2009 and are now
assessed as having a highly probable
likelihood of occurrence and a major
potential financial impact.
Supplier default risks
Over 95% of our product offering is
sourced through independent suppliers,
mainly located in Asia see Global
Operations, p. 106. To reduce the risk
of business interruptions following a
potential supplier default, we work with
vendors who demonstrate reliability,
quality, innovation and continuous
improvement.
In addition, we have bought insurance
coverage for the risk of business inter-
ruptions caused by physical damage to
supplier premises.
Therefore, we assess supplier default
risks as having a possible likelihood of
occurrence and a moderate potential
financial impact.
Inventory risks
As we place initial production orders
around six months in advance of
delivery, the adidas Group is exposed to
inventory risks relating to misjudging
consumer demand at the time of
production planning. A sudden decline
in demand has the potential to cause
excess inventories. This can have
negative implications for our financial
performance, including higher levels
of clearance activity and inventory
obsolescence as well as reduced liquidity
due to higher operating working capital
requirements.
On the other hand, a sudden increase
in demand can lead to product short-
falls at the point of sale. In this situation,
our Group faces the risk of missed
sales opportunities and/or customer
and consumer disappointment, which
could lead to a reduction in brand loyalty
and our reputation as an on-time, in-full
supplier. In addition, the Group faces
potential profitability impacts from costs
such as air freight in efforts to speed up
replenishment.
In order to mitigate these risks, we
continuously strive to improve our fore-
casting and material planning processes.
Our replenishment programmes are
another example of how we are striving
to shorten production lead times,
ensuring availability of products while
avoiding excess inventories see Global
Operations, p. 106.
Although the expected over-
proportionate growth of the Retail
segment will increase the exposure
towards swings in consumer demand,
our demand and inventory planning
accuracy for 2011 will benefit from the
improved macroeconomic climate versus
2010. Therefore, the associated inventory
risks have decreased slightly and are now
assessed as having a possible likelihood
of occurrence and a moderate potential
financial impact on our Group.
Customer risks
Customer risks arise from our depend-
ence on key customers who have the
ability to exert bargaining power and can
therefore cause considerable margin
pressure or cancel orders. These risks
exist not only due to the relative size
of some of our major customers, but
also as a result of our limited ability to
influence how they conduct business. In
addition, over recent years, several large
customers have been expanding their
own private brand and private label busi-
nesses, which can negatively impact our
efforts to increase shelf space.