Reebok 2010 Annual Report Download - page 238
Download and view the complete annual report
Please find page 238 of the 2010 Reebok annual report below. You can navigate through the pages in the report by either clicking on the pages listed below, or by using the keyword search tool below to find specific information within the annual report.-
 1
1 -
2
-
3
-
4
-
5
-
6
-
7
-
8
-
9
-
10
-
11
-
12
-
13
-
14
-
15
-
16
-
17
-
18
-
19
-
20
-
21
-
22
-
23
-
24
-
25
-
26
-
27
-
28
-
29
-
30
-
31
-
32
-
33
-
34
-
35
-
36
-
37
-
38
-
39
-
40
-
41
-
42
-
43
-
44
-
45
-
46
-
47
-
48
-
49
-
50
-
51
-
52
-
53
-
54
-
55
-
56
-
57
-
58
-
59
-
60
-
61
-
62
-
63
-
64
-
65
-
66
-
67
-
68
-
69
-
70
-
71
-
72
-
73
-
74
-
75
-
76
-
77
-
78
-
79
-
80
-
81
-
82
-
83
-
84
-
85
-
86
-
87
-
88
-
89
-
90
-
91
-
92
-
93
-
94
-
95
-
96
-
97
-
98
-
99
-
100
-
101
-
102
-
103
-
104
-
105
-
106
-
107
-
108
-
109
-
110
-
111
-
112
-
113
-
114
-
115
-
116
-
117
-
118
-
119
-
120
-
121
-
122
-
123
-
124
-
125
-
126
-
127
-
128
-
129
-
130
-
131
-
132
-
133
-
134
-
135
-
136
-
137
-
138
-
139
-
140
-
141
-
142
-
143
-
144
-
145
-
146
-
147
-
148
-
149
-
150
-
151
-
152
-
153
-
154
-
155
-
156
-
157
-
158
-
159
-
160
-
161
-
162
-
163
-
164
-
165
-
166
-
167
-
168
-
169
-
170
-
171
-
172
-
173
-
174
-
175
-
176
-
177
-
178
-
179
-
180
-
181
-
182
-
183
-
184
-
185
-
186
-
187
-
188
-
189
-
190
-
191
-
192
-
193
-
194
-
195
-
196
-
197
-
198
-
199
-
200
-
201
-
202
-
203
-
204
-
205
-
206
-
207
-
208
-
209
-
210
-
211
-
212
-
213
-
214
-
215
-
216
-
217
-
218
-
219
-
220
-
221
-
222
-
223
-
224
-
225
-
226
-
227
-
 228
228 -
 229
229 -
 230
230 -
 231
231 -
 232
232 -
 233
233 -
 234
234 -
 235
235 -
 236
236 -
 237
237 -
 238
238 -
 239
239 -
 240
240 -
 241
241 -
 242
242 -
 243
243 -
 244
244 -
 245
245 -
 246
246 -
 247
247 -
 248
248
 |
 |
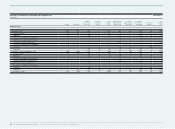
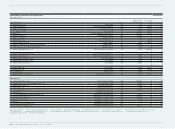
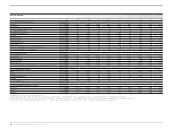
234 Additional Information Ten-Year Overview
Ten-Year Overview
2010 2009 2008 2007 2006 1 ) 2005 2004 2003 2002 2001
Income Statement Data (€ in millions)
Net sales 2 ) 11,990 10,381 10,799 10,299 10,084 6,636 5,860 6,267 6,523 6,112
Gross profit 2 ) 5,730 4,712 5,256 4,882 4,495 3,197 2,813 2,814 2,819 2,601
Royalty and commission income 2 ) 100 86 89 102 90 47 42 42 46 42
Other operating income 2 ) 110 100 103 80 55 36 n/a n/a n/a n/a
Other operating expenses 2 ) 5,046 4,390 4,378 4,115 3,759 2,573 n/a n/a n/a n/a
EBITDA 2 ) 1,159 780 1,280 1,165 1,078 806 716 652 622 620
Operating profit 2) 3) 894 508 1,070 949 881 707 584 490 477 475
Financial result 2) 4) (88) (150) (166) (135) (158) (52) (59) (49) (87) (102)
Income before taxes 2) 4) 806 358 904 815 723 655 526 438 390 376
Income taxes 2 ) 238 113 260 260 227 221 193 167 148 147
Net income attributable to non-controlling interests 2) 4) (1) 0 (2) (4) (13) (8) (7) (11) (14) (21)
Net income attributable to shareholders 5 ) 567 245 642 551 483 383 314 260 229 208
Income Statement Ratios
Gross margin 2 ) 47.8% 45.4% 48.7% 47.4% 44.6% 48.2% 48.0% 44.9% 43.2% 42.6%
Operating margin 2) 3) 7.5% 4.9% 9.9% 9.2% 8.7% 10.7% 10.0% 7.8% 7.3% 7.8%
Interest coverage 2 ) 10.1 3.9 7.4 6.8 5.9 18.4 10.2 8.4 6.4 4.9
Effective tax rate 2 ) 29.5% 31.5% 28.8% 31.8% 31.4% 33.7% 36.7% 38.0% 37.9% 39.0%
Net income attributable to shareholders as a percentage of net sales 5 ) 4.7% 2.4% 5.9% 5.4% 4.8% 5.8% 5.4% 4.2% 3.5% 3.4%
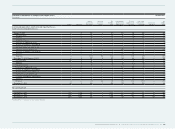
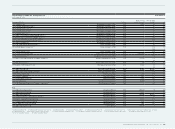
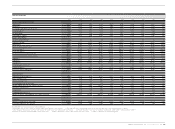
Net sales by brand (€ in millions)
adidas 8,714 7,520 7,821 7,113 6,626 5,861 5,174 4,950 5,105 4,825
Reebok 1,913 1,603 1,717 1,831 1,979 — — — — —
TaylorMade-adidas Golf 909 831 812 804 856 709 633 637 707 545
Rockport 252 232 243 291 293 — — — — —
Reebok-CCM Hockey 200 177 188 210 202 — — — — —
Net sales by product category (€ in millions)
Footwear 2 ) 5,389 4,642 4,919 4,751 4,733 2,978 2,620 2,767 2,851 2,650
Apparel 2 ) 5,380 4,663 4,775 4,426 4,105 2,798 2,462 2,222 2,288 2,212
Hardware 2 ) 1,221 1,076 1,105 1,121 1,246 860 778 1,278 1,385 1,250
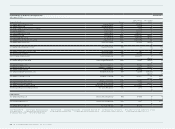
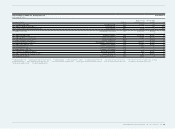
Rounding differences may arise in percentages and totals.
1) Including Reebok, Reebok-CCM Hockey and Rockport from February 1, 2006 onwards. 2) 2004 and 2005 reflect continuing operations as a result of the divestiture of the Salomon business segment.
3) Operating profit figures prior to 2004 exclude royalty and commission income and goodwill amortisation. 4) 2003 and 2004 figures have been restated due to application of IAS 32/IAS 39 and amendment to IAS 19.
5) Includes income from continuing and discontinued operations. 6) Figures adjusted for 1:4 share split conducted on June 6, 2006. 7) Subject to Annual General Meeting approval.