Rogers 2005 Annual Report Download - page 99
Download and view the complete annual report
Please find page 99 of the 2005 Rogers annual report below. You can navigate through the pages in the report by either clicking on the pages listed below, or by using the keyword search tool below to find specific information within the annual report.-
 1
1 -
2
-
3
-
4
-
5
-
6
-
7
-
8
-
9
-
10
-
11
-
12
-
13
-
14
-
15
-
16
-
17
-
18
-
19
-
20
-
21
-
22
-
23
-
24
-
25
-
26
-
27
-
28
-
29
-
30
-
31
-
32
-
33
-
34
-
35
-
36
-
37
-
38
-
39
-
40
-
41
-
42
-
43
-
44
-
45
-
46
-
47
-
48
-
49
-
50
-
51
-
52
-
53
-
54
-
55
-
56
-
57
-
58
-
59
-
60
-
61
-
62
-
63
-
64
-
65
-
66
-
67
-
68
-
69
-
70
-
71
-
72
-
73
-
74
-
75
-
76
-
77
-
78
-
79
-
80
-
81
-
82
-
83
-
84
-
85
-
86
-
87
-
88
-
 89
89 -
 90
90 -
 91
91 -
 92
92 -
 93
93 -
 94
94 -
 95
95 -
 96
96 -
 97
97 -
 98
98 -
 99
99 -
 100
100 -
 101
101 -
 102
102 -
 103
103 -
 104
104 -
 105
105 -
 106
106 -
 107
107 -
 108
108 -
 109
109 -
110
-
111
-
112
-
113
-
114
-
115
-
116
-
117
-
118
-
119
-
120
-
121
-
122
-
123
-
124
-
125
-
126
-
127
-
128
-
129
-
130
-
131
-
132
-
133
-
134
-
135
-
136
-
137
-
138
-
139
-
140
-
141
-
142
-
143
-
144
-
145
-
146
-
147
-
148
-
149
-
150
-
151
-
152
-
153
-
154
 |
 |

95 ROGERS 2005 ANNUAL REPORT . MANAGEMENT’S DISCUSSION AND ANALYSIS OF FINANCIAL CONDITION AND RESULTS OF OPERATIONS
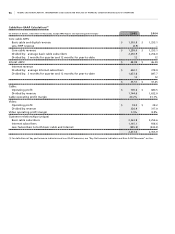
Wireless Non-GAAP Calculations(1)
(In millions of dollars, except per subscriber figures; subscribers in thousands) 2005 2004
Postpaid ARPU (monthly)
Postpaid (voice and data) revenue $ 3,383.5 $ 2,361.1
Divided by: average postpaid wireless voice and data subscribers 4,435.8 3,306.9
Divided by: 12 months 12 12
$ 63.56 $ 59.50
Prepaid ARPU (monthly)
Prepaid revenue $ 209.6 $ 116.7
Divided by: average prepaid subscribers 1,323.2 818.5
Divided by: 12 months 12 12
$ 13.20 $ 11.88
Blended ARPU (monthly)
Postpaid (voice and data) revenue plus prepaid revenue $ 3,593.1 $ 2,477.8
Divided by: average postpaid and prepaid wireless voice and data subscribers 5,759.0 4,125.4
Divided by: 12 months 12 12
$ 51.99 $ 50.05
One-way messaging ARPU (monthly)
One-way messaging revenue $ 19.6 $ 24.5
Divided by: average one-way messaging subscribers 179.9 220.5
Divided by: 12 months 12 12
$ 9.09 $ 9.25
Cost of acquisition per gross addition
Total sales and marketing expenses $ 603.8 $ 444.4
Equipment margin loss (acquisition related) 191.0 117.5
$ 794.8 $ 561.9
Total gross wireless additions (postpaid, prepaid, and one-way messaging) 2,053.0 1,509.5
$ 387 $ 372
Operating expense per average subscriber (monthly)
Operating, general, administrative and integration expenses $ 1,292.5 $ 879.1
Equipment margin loss (retention related) 188.3 110.9
$ 1,480.8 $ 990.0
Divided by: average total wireless subscribers 5,938.9 4,345.9
Divided by: 12 months 12 12
$ 20.78 $ 18.99
Equipment margin loss
Equipment sales $ 393.9 $ 281.2
Cost of equipment sales (773.2) (509.6)
$ (379.3) $ (228.4)
Acquisition related $ (191.0) $ (117.5)
Retention related (188.3) (110.9)
$ (379.3) $ (228.4)
(1) For definitions of key performance indicators and non-GAAP measures, see “Key Performance Indicators and Non-GAAP Measures” section.