Rogers 2005 Annual Report Download - page 96
Download and view the complete annual report
Please find page 96 of the 2005 Rogers annual report below. You can navigate through the pages in the report by either clicking on the pages listed below, or by using the keyword search tool below to find specific information within the annual report.-
 1
1 -
2
-
3
-
4
-
5
-
6
-
7
-
8
-
9
-
10
-
11
-
12
-
13
-
14
-
15
-
16
-
17
-
18
-
19
-
20
-
21
-
22
-
23
-
24
-
25
-
26
-
27
-
28
-
29
-
30
-
31
-
32
-
33
-
34
-
35
-
36
-
37
-
38
-
39
-
40
-
41
-
42
-
43
-
44
-
45
-
46
-
47
-
48
-
49
-
50
-
51
-
52
-
53
-
54
-
55
-
56
-
57
-
58
-
59
-
60
-
61
-
62
-
63
-
64
-
65
-
66
-
67
-
68
-
69
-
70
-
71
-
72
-
73
-
74
-
75
-
76
-
77
-
78
-
79
-
80
-
81
-
82
-
83
-
84
-
85
-
 86
86 -
 87
87 -
 88
88 -
 89
89 -
 90
90 -
 91
91 -
 92
92 -
 93
93 -
 94
94 -
 95
95 -
 96
96 -
 97
97 -
 98
98 -
 99
99 -
 100
100 -
 101
101 -
 102
102 -
 103
103 -
 104
104 -
 105
105 -
 106
106 -
107
-
108
-
109
-
110
-
111
-
112
-
113
-
114
-
115
-
116
-
117
-
118
-
119
-
120
-
121
-
122
-
123
-
124
-
125
-
126
-
127
-
128
-
129
-
130
-
131
-
132
-
133
-
134
-
135
-
136
-
137
-
138
-
139
-
140
-
141
-
142
-
143
-
144
-
145
-
146
-
147
-
148
-
149
-
150
-
151
-
152
-
153
-
154
 |
 |

92 ROGERS 2005 ANNUAL REPORT . MANAGEMENT’S DISCUSSION AND ANALYSIS OF FINANCIAL CONDITION AND RESULTS OF OPERATIONS
$513.5 million, with 36.6% growth at Wireless, 1.7% growth at Cable, a 29.2% decline at Media and the inclusion of
$22.9 million at Telecom. The fourth quarter results in 2005 also reflected integration expenses of $25.3 million at
Wireless, $2.3 million at Telecom and $5.3 million at Corporate.
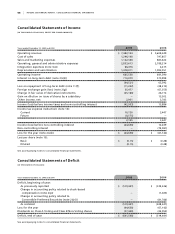
Consolidated operating income for the three months ended December 31, 2005, totalled $112.9 million, an
increase of 2.2% compared to the corresponding period of 2004 due to the growth in Wireless and the inclusion of
Telecom, offset by total integration expenses of $32.9 million and the additional amortization of intangible assets which
arose on the acquisition of Call-Net in the third quarter of 2005 and the acquisitions of Fido and the minority interests
in Wireless in the fourth quarter of 2004. Amortization of intangibles totalled approximately $99.0 million in the three
months ended December 31, 2005 compared to approximately $49.4 million in the corresponding period in 2004.
We recorded a net loss of $66.7 million for the three months ended December 31, 2005, or basic loss per share
of $0.22 (diluted – $0.22), compared to a net loss of $29.1 million or basic loss per share of $0.12 (diluted – $0.12) in the
corresponding period of 2004. While we experienced growth in operating profit, a deferred income tax recovery, and
lower interest expense during the three months ended December 31, 2005 relative to the corresponding period in 2004,
the increased net loss was due to integration expenses, the amortization of intangibles assumed on acquisition and the
fact that the prior year’s quarter reflects foreign exchange gains and other income totalling $47.0 million.
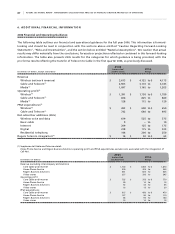
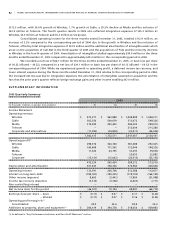
S U P P L E M E N T A R Y I N F O R M A T I O N
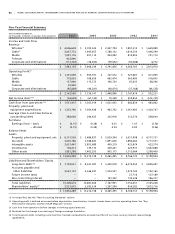
2005 Quarterly Summary
2005
(In thousands of dollars, except per share amounts) Q1 Q2 Q3 Q4
Income Statement
Operating revenue
Wireless $ 875,371 $ 963,888 $ 1,068,888 $ 1,098,511
Cable 505,256 500,079 513,072 549,326
Media 219,280 293,402 284,520 299,974
Telecom – – 212,604 211,286
Corporate and eliminations (17,492) (24,858) (32,017) (38,936)
1,582,415 1,732,511 2,047,067 2,120,161
Operating profit(1)
Wireless 298,376 364,760 381,488 292,425
Cable 180,669 171,562 172,046 194,326
Media 11,320 44,195 33,293 39,038
Telecom – – 23,055 22,885
Corporate (15,141) (15,063) (20,510) (35,155)
475,224 565,454 589,372 513,519
Depreciation and amortization 341,633 358,746 376,984 400,648
Operating income 133,591 206,708 212,388 112,871
Interest on long-term debt (184,767) (180,325) (178,792) (166,195)
Other income (expense) 8,663 (3,441) 17,894 (21,098)
Income tax recovery (expense) (3,514) (3,748) (2,603) 7,710
Non-controlling interest – – – –
Net income (loss) for the period (46,027) 19,194 48,887 (66,712)
Earnings (loss) per share – basic $ (0.17) $ 0.07 $ 0.17 $ (0.22)
– diluted $ (0.17) $ 0.07 $ 0.16 $ (0.22)
Operating profit margin %(1)
Consolidated 30.0 32.6 28.8 24.2
Additions to property, plant and equipment(1) $ 260,419 $ 344,738 $ 318,656 $ 429,983
(1) As defined in “Key Performance Indicators and Non-GAAP Measures” section.