Rogers 2005 Annual Report Download - page 42
Download and view the complete annual report
Please find page 42 of the 2005 Rogers annual report below. You can navigate through the pages in the report by either clicking on the pages listed below, or by using the keyword search tool below to find specific information within the annual report.-
 1
1 -
2
-
3
-
4
-
5
-
6
-
7
-
8
-
9
-
10
-
11
-
12
-
13
-
14
-
15
-
16
-
17
-
18
-
19
-
20
-
21
-
22
-
23
-
24
-
25
-
26
-
27
-
28
-
29
-
30
-
31
-
 32
32 -
 33
33 -
 34
34 -
 35
35 -
 36
36 -
 37
37 -
 38
38 -
 39
39 -
 40
40 -
 41
41 -
 42
42 -
 43
43 -
 44
44 -
 45
45 -
 46
46 -
 47
47 -
 48
48 -
 49
49 -
 50
50 -
 51
51 -
 52
52 -
53
-
54
-
55
-
56
-
57
-
58
-
59
-
60
-
61
-
62
-
63
-
64
-
65
-
66
-
67
-
68
-
69
-
70
-
71
-
72
-
73
-
74
-
75
-
76
-
77
-
78
-
79
-
80
-
81
-
82
-
83
-
84
-
85
-
86
-
87
-
88
-
89
-
90
-
91
-
92
-
93
-
94
-
95
-
96
-
97
-
98
-
99
-
100
-
101
-
102
-
103
-
104
-
105
-
106
-
107
-
108
-
109
-
110
-
111
-
112
-
113
-
114
-
115
-
116
-
117
-
118
-
119
-
120
-
121
-
122
-
123
-
124
-
125
-
126
-
127
-
128
-
129
-
130
-
131
-
132
-
133
-
134
-
135
-
136
-
137
-
138
-
139
-
140
-
141
-
142
-
143
-
144
-
145
-
146
-
147
-
148
-
149
-
150
-
151
-
152
-
153
-
154
 |
 |

38 ROGERS 2005 ANNUAL REPORT . MANAGEMENT’S DISCUSSION AND ANALYSIS OF FINANCIAL CONDITION AND RESULTS OF OPERATIONS
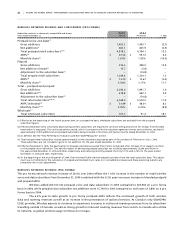
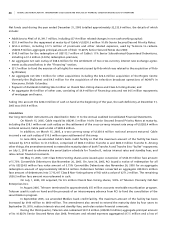
CA B L E R EV E NU E AN D S U BS C R IB E RS
(Subscriber statistics in thousands, except ARPU)
Years ended December 31, 2 0 0 5 2 0 0 4 % Chg
Homes passed 3,387.5 3,291.1 2.9
Customer relationships(1) 2,413.0 2,355.9 2.4
Customer relationships, net additions(2) 57.1 16.6 –
Basic cable subscribers 2,263.8 2,254.6 0.4
Basic cable, net additions (losses)(2) 9.2 (14.8) –
Core cable ARPU(1) $ 48.09 $ 46.29 3.9
Internet subscribers 1,145.1 936.6 22.3
Internet, net additions(2) 208.5 158.8 31.3
Internet ARPU(1) $ 35.51 $ 37.25 (4.7)
Digital terminals in service 1,139.7 795.7 43.2
Digital terminals, net additions 344.0 182.1 88.9
Digital households 913.2 675.4 35.2
Digital households, net additions(2) 237.8 140.1 69.7
Cable telephony subscribers 47.9 – –
Cable telephony, net additions 47.9 – –
(1) As defined. See the “Key Performance Indicators and Non-GAAP Measures” section.
(2) Effective August 2005, voluntarily deactivating cable subscribers are required to continue service for 30 days from the date termination is
requested. This continued service period, which is in accordance with the billing and subscriber agreement terms and conditions, had the
impact of increasing net basic cable, Internet and digital household subscriber net additions by approximately 9,500, 5,200 and 3,800,
respectively, for the year ended December 31, 2005.
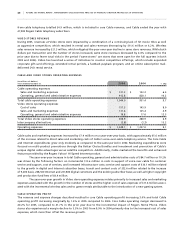
CO R E C A BL E R E V EN U E
The increase in Core Cable revenue of 4.1%, which includes cable telephony revenues noted below, and the increase in
ARPU to $48.09 from $46.29 compared to the prior year, reflect the growing penetration of Cable’s digital products, its
continued up-selling of customers into enhanced programming packages, and pricing increases. These increases were
partially offset by the impact of discounts associated with increasing adoption of Cable’s bundled offerings which offer a
discount on price and to the declined equipment revenues resulting primarily from a decrease in equipment rental prices.
To mitigate impacts on ARPU and operating profit margins associated with bundled offering discounts, effective during
the fourth quarter of 2005, Cable modified its Better Choice Bundle plans to reduce certain of the available discounts.
On a year-over-year basis, approximately 65.2% of the Cable TV revenue growth is due to the increased digital
subscriber base, which grew by approximately 237,800 households in the year.
IN T E RN E T R EV E N UE
The growth in Internet revenues of 16.3% primarily reflects the 22.3% increase in the number of Internet subscribers
from the previous year. Cable believes this increase in subscribers is due primarily to the marketing of Cable’s Rogers
Yahoo! offering and Rogers Better Choice Bundle promotions, and the ability to attract customers with varying needs.
This ability to meet the needs of the Internet consumer has resulted in an acceleration of net additions in 2005. Average
monthly revenue per Internet subscriber has decreased over 2004 reflecting the increased penetration of lower-priced
offerings and the impact of bundling, which Cable believes to be an effective tactic in retaining customers.
During the year, net Internet additions of 208,500 represented an increase of 31.3% compared to last year.
With the Internet subscriber base at approximately 1.15 million, Cable has 44.0% Internet penetration of basic cable
households, and 33.8% Internet penetration as a percentage of all homes passed by Cable’s networks.
In the first quarter of 2006, Cable implemented price increases of between $2 to $5 from the published retail
rates for certain of its core cable and Internet product offerings.
CA B L E T EL E PH O N Y R EV E NU E AN D S U BS C R IB E RS
The Rogers Home Phone voice-over-cable telephony service was launched on July 1, 2005 in the Greater Toronto Area
and during the balance of the year, its availability continued to expand. For the year ended December 31, 2005, revenues