Rogers 2005 Annual Report Download - page 138
Download and view the complete annual report
Please find page 138 of the 2005 Rogers annual report below. You can navigate through the pages in the report by either clicking on the pages listed below, or by using the keyword search tool below to find specific information within the annual report.-
 1
1 -
2
-
3
-
4
-
5
-
6
-
7
-
8
-
9
-
10
-
11
-
12
-
13
-
14
-
15
-
16
-
17
-
18
-
19
-
20
-
21
-
22
-
23
-
24
-
25
-
26
-
27
-
28
-
29
-
30
-
31
-
32
-
33
-
34
-
35
-
36
-
37
-
38
-
39
-
40
-
41
-
42
-
43
-
44
-
45
-
46
-
47
-
48
-
49
-
50
-
51
-
52
-
53
-
54
-
55
-
56
-
57
-
58
-
59
-
60
-
61
-
62
-
63
-
64
-
65
-
66
-
67
-
68
-
69
-
70
-
71
-
72
-
73
-
74
-
75
-
76
-
77
-
78
-
79
-
80
-
81
-
82
-
83
-
84
-
85
-
86
-
87
-
88
-
89
-
90
-
91
-
92
-
93
-
94
-
95
-
96
-
97
-
98
-
99
-
100
-
101
-
102
-
103
-
104
-
105
-
106
-
107
-
108
-
109
-
110
-
111
-
112
-
113
-
114
-
115
-
116
-
117
-
118
-
119
-
120
-
121
-
122
-
123
-
124
-
125
-
126
-
127
-
 128
128 -
 129
129 -
 130
130 -
 131
131 -
 132
132 -
 133
133 -
 134
134 -
 135
135 -
 136
136 -
 137
137 -
 138
138 -
 139
139 -
 140
140 -
 141
141 -
 142
142 -
 143
143 -
 144
144 -
 145
145 -
 146
146 -
 147
147 -
 148
148 -
149
-
150
-
151
-
152
-
153
-
154
 |
 |

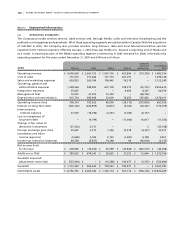
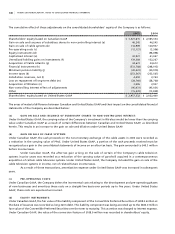
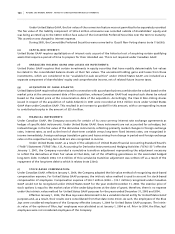
134 ROGERS 2005 ANNUAL REPORT . NOTES TO CONSOLIDATED FINANCIAL STATEMENTS
Corporate
items and Consolidated
2004 Wireless Cable Media eliminations Total
Operating revenue $ 2,783,525 $ 1,945,655 $ 956,962 $ (77,893) $ 5,608,249
Cost of sales 509,540 145,936 142,381 – 797,857
Sales and marketing expenses 444,379 248,754 190,489 – 883,622
Operating, general and administrative expenses 874,800 842,306 508,720 (37,612) 2,188,214
Integration expenses 4,415 – – – 4,415
Management fees 11,675 38,913 13,661 (64,249) –
Depreciation and amortization 497,674 486,038 67,342 41,497 1,092,551
Operating income (loss) 441,042 183,708 34,369 (17,529) 641,590
Interest on long-term debt (219,366) (247,365) (14,043) (95,224) (575,998)
Intercompany:
Interest expense (7,196) (552) (42,225) 49,973 –
Dividends – – 42,915 (42,915) –
Loss on repayment of long-term debt (2,313) (18,013) – (7,884) (28,210)
Change in fair value of derivative instruments (7,796) 34,570 – – 26,774
Foreign exchange gain (loss) (46,714) (41,089) (154) 20,402 (67,555)
Investment and other income (expense) 7,939 (872) (19,522) 31,740 19,285
Income tax reduction (expense) (6,487) (1,196) (2,606) 6,842 (3,447)
Non-controlling interest – – – (79,581) (79,581)
Net income (loss) for the year $ 159,109 $ (90,809) $ (1,266) $ (134,176) $ (67,142)
Additions to PP&E $ 439,157 $ 587,906 $ 20,322 $ 7,553 $ 1,054,938
Goodwill acquired/adjustments (note 6(a)) $ 1,360,746 $ – $ 148,530 $ (12,225) $ 1,497,051
Goodwill $ 1,739,465 $ 926,445 $ 720,229 $ 2,548 $ 3,388,687
Identifiable assets $ 5,054,803 $ 3,861,925 $ 1,224,559 $ 3,131,451 $ 13,272,738
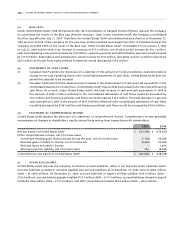
(b ) PR O DU C T R E VE N UE:
Revenue from external customers is comprised of the following:
2005 2004
Wireless:
Post-paid (voice and data) $ 3,383,444 $ 2,361,128
Prepaid 209,588 116,658
One-way messaging 19,628 24,480
Equipment sales 393,998 281,259
4,006,658 2,783,525
Cable:
Cable 1,298,956 1,253,053
Internet 440,664 378,912
Rogers Home Phone 4,938 –
Video store operations 326,926 316,954
Intercompany eliminations (3,751) (3,264)
2,067,733 1,945,655
Media:
Advertising 503,948 470,768
Circulation and subscription 137,247 126,852
Retail 251,792 230,865
Other 55,496 71,278
Blue Jays 148,693 57,199
1,097,176 956,962
Telecom:
Consumer 149,010 –
Business 274,880 –
423,890 –
Corporate items and intercompany eliminations (113,303) (77,893)
$ 7,482,154 $ 5,608,249