Rogers 2005 Annual Report Download - page 136
Download and view the complete annual report
Please find page 136 of the 2005 Rogers annual report below. You can navigate through the pages in the report by either clicking on the pages listed below, or by using the keyword search tool below to find specific information within the annual report.-
 1
1 -
2
-
3
-
4
-
5
-
6
-
7
-
8
-
9
-
10
-
11
-
12
-
13
-
14
-
15
-
16
-
17
-
18
-
19
-
20
-
21
-
22
-
23
-
24
-
25
-
26
-
27
-
28
-
29
-
30
-
31
-
32
-
33
-
34
-
35
-
36
-
37
-
38
-
39
-
40
-
41
-
42
-
43
-
44
-
45
-
46
-
47
-
48
-
49
-
50
-
51
-
52
-
53
-
54
-
55
-
56
-
57
-
58
-
59
-
60
-
61
-
62
-
63
-
64
-
65
-
66
-
67
-
68
-
69
-
70
-
71
-
72
-
73
-
74
-
75
-
76
-
77
-
78
-
79
-
80
-
81
-
82
-
83
-
84
-
85
-
86
-
87
-
88
-
89
-
90
-
91
-
92
-
93
-
94
-
95
-
96
-
97
-
98
-
99
-
100
-
101
-
102
-
103
-
104
-
105
-
106
-
107
-
108
-
109
-
110
-
111
-
112
-
113
-
114
-
115
-
116
-
117
-
118
-
119
-
120
-
121
-
122
-
123
-
124
-
125
-
 126
126 -
 127
127 -
 128
128 -
 129
129 -
 130
130 -
 131
131 -
 132
132 -
 133
133 -
 134
134 -
 135
135 -
 136
136 -
 137
137 -
 138
138 -
 139
139 -
 140
140 -
 141
141 -
 142
142 -
 143
143 -
 144
144 -
 145
145 -
 146
146 -
147
-
148
-
149
-
150
-
151
-
152
-
153
-
154
 |
 |

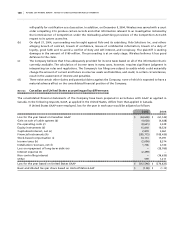
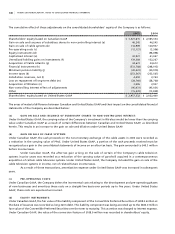
132 ROGERS 2005 ANNUAL REPORT . NOTES TO CONSOLIDATED FINANCIAL STATEMENTS
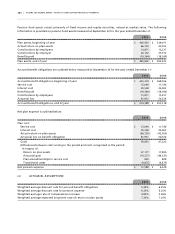
Expected return on assets represents management’s best estimate of the long-term rate of return on plan
assets applied to the fair value of the plan assets. The Company establishes its estimate of the expected rate of return on
plan assets based on the fund’s target asset allocation and estimated rate of return for each asset class. Estimated rates
of return are based on expected returns from fixed income securities which take into account bond yields. An equity
risk premium is then applied to estimate equity returns. Differences between expected and actual return are included in
actuarial gains and losses.
The estimated average remaining service periods for the plans range from 9 to 13 years. The Company does not
have any curtailment gains or losses.
(b ) AL L OC A T IO N O F PL A N A SS E TS:
Percentage of Percentage of
plan assets, plan assets, Target asset
December 31, December 31, allocation
Asset category 2005 2004 percentage
Equity securities 59.5% 58.9% 50% to 65%
Debt securities 39.9% 40.2% 35% to 50%
Other (cash) 0.6% 0.9% 0% to 1%
100.0% 100.0%
Plan assets are comprised primarily of pooled funds that invest in common stocks and bonds. The pooled Canadian
equity fund has investments in the Company’s equity securities comprising approximately 1% of the pooled fund. This
results in approximately $0.8 million (2004 – $0.7 million) of the plans’ assets being indirectly invested in the Company’s
equity securities.
The Company makes contributions to the plans to secure the benefits of plan members and invests in permit-
ted investments using the target ranges established by the Pension Committee of the Company. The Pension Committee
reviews actuarial assumptions on an annual basis.
(c ) A C TUA L C O NT R IBU T IO N S T O T H E P LA N S A R E A S F O LL O WS :
Employer Employee Total
2004 $ 19,423 $ 13,238 $ 32,661
2005
21,466 14,088 35,554
Expected contributions by the Company in 2006 are estimated to be $31.7 million.
Employee contributions for 2006 are assumed to be at levels similar to 2004 and 2005 on the assumption staff-
ing levels in the Company will remain the same on a year-over-year basis.
(d ) EX P EC T E D C AS H FL O WS :
Expected benefit payments for fiscal year ending:
2006 $ 24,600
2007 24,300
2008 24,200
2009
24,000
2010 23,900
121,000
Next 5 years 124,800
$ 245,800
Blue Jays and Fido each have defined contribution plans with total pension expense of $5.3 million in 2005 (2004 – $0.9 million).