Rogers 2005 Annual Report Download - page 36
Download and view the complete annual report
Please find page 36 of the 2005 Rogers annual report below. You can navigate through the pages in the report by either clicking on the pages listed below, or by using the keyword search tool below to find specific information within the annual report.-
 1
1 -
2
-
3
-
4
-
5
-
6
-
7
-
8
-
9
-
10
-
11
-
12
-
13
-
14
-
15
-
16
-
17
-
18
-
19
-
20
-
21
-
22
-
23
-
24
-
25
-
 26
26 -
 27
27 -
 28
28 -
 29
29 -
 30
30 -
 31
31 -
 32
32 -
 33
33 -
 34
34 -
 35
35 -
 36
36 -
 37
37 -
 38
38 -
 39
39 -
 40
40 -
 41
41 -
 42
42 -
 43
43 -
 44
44 -
 45
45 -
 46
46 -
47
-
48
-
49
-
50
-
51
-
52
-
53
-
54
-
55
-
56
-
57
-
58
-
59
-
60
-
61
-
62
-
63
-
64
-
65
-
66
-
67
-
68
-
69
-
70
-
71
-
72
-
73
-
74
-
75
-
76
-
77
-
78
-
79
-
80
-
81
-
82
-
83
-
84
-
85
-
86
-
87
-
88
-
89
-
90
-
91
-
92
-
93
-
94
-
95
-
96
-
97
-
98
-
99
-
100
-
101
-
102
-
103
-
104
-
105
-
106
-
107
-
108
-
109
-
110
-
111
-
112
-
113
-
114
-
115
-
116
-
117
-
118
-
119
-
120
-
121
-
122
-
123
-
124
-
125
-
126
-
127
-
128
-
129
-
130
-
131
-
132
-
133
-
134
-
135
-
136
-
137
-
138
-
139
-
140
-
141
-
142
-
143
-
144
-
145
-
146
-
147
-
148
-
149
-
150
-
151
-
152
-
153
-
154
 |
 |

32 ROGERS 2005 ANNUAL REPORT . MANAGEMENT’S DISCUSSION AND ANALYSIS OF FINANCIAL CONDITION AND RESULTS OF OPERATIONS
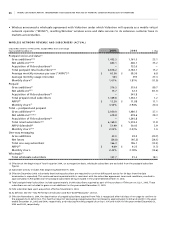
Pro forma data revenue grew by 92.0% year-over-year, to $297.0 million for 2005. Data revenues represented
approximately 8.2% of network revenue in 2005 compared to 5.1% of pro forma network revenue in 2004, reflecting the
continued rapid growth of Blackberry, SMS and MMS, downloadable ring tones, music, games, and other wireless data
services and applications.
Prepaid ARPU for 2005 decreased on a pro forma basis by 3.4% versus 2004 to $13.20. The decline primarily
reflects the increased focus by Fido on higher revenue postpaid subscribers and the introduction of competitive prepaid
offerings into the market.
Postpaid voice and data subscriber churn decreased to 1.61% for the year from the pro forma rate of 1.93% in
2004 as a result of Wireless’ proactive and targeted customer retention activities as well as from the increased network
density and coverage quality resulting from the integration of the Fido GSM network.
Prepaid churn increased to 3.54% in 2005 from the pro forma rate of 3.17% in 2004. Eliminating the impact of
the change in Fido deactivation policy, churn increased from 3.45% in 2004 to 3.64% in 2005.
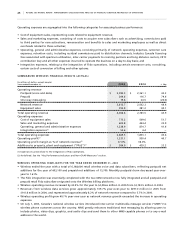
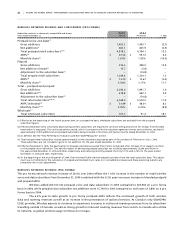
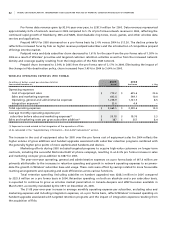
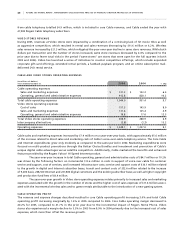
WI R E LE S S O PE R A TI N G E XP E N SE S ( P RO F OR M A)
(In millions of dollars, except per subscriber statistics) 2 0 0 5 2 0 0 4
Years ended December 31, Actual Pro Forma % Chg
Operating expenses
Cost of equipment sales $ 773.2 $ 625.6 23.6
Sales and marketing expenses 603.8 549.1 10.0
Operating, general and administrative expenses 1,238.9 1,141.5 8.5
Integration expenses(1) 53.6 4.4 –
Total operating expenses $ 2,669.5 $ 2,320.6 15.0
Average monthly operating expense per
subscriber before sales and marketing expenses(2) $ 20.78 $ 19.70 5.5
Sales and marketing costs per gross subscriber addition(2) $ 387 $ 357 8.4
(1) Expenses incurred related to the integration of the operations of Fido.
(2) As calculated in the “Supplementary Information – Non-GAAP Calculations” section.
The increase in the cost of equipment sales for 2005 over the pro forma cost of equipment sales for 2004 reflects the
higher volume of gross additions and handset upgrades associated with subscriber retention programs combined with
the generally higher price points of more sophisticated handsets and devices.
Marketing efforts during 2005 included targeted programs to acquire high-value customers on longer-term
contracts, including the successful Motorola RAZR V3 phone campaign, resulting in an 8.4% pro forma increase in sales
and marketing costs per gross addition to $387 for 2005.
The year-over-year operating, general and administrative expenses on a pro forma basis of $97.4 million are
primarily attributable to the increases in retention spending and growth in network operating expenses to accommo-
date the growth in Wireless’ subscriber base and usage. These costs were offset by savings related to more favourable
roaming arrangements and operating and scale efficiencies across various functions.
Total retention spending (including subsidies on handset upgrades) was $288.3 million in 2005 compared
to $225.9 million on a pro forma basis in 2004. Retention spending, on both an absolute and a per subscriber basis,
is expected to continue to grow as wireless market penetration in Canada deepens and WNP becomes available in
March 2007, as recently mandated by the CRTC on December 20, 2005.
The $1.08 year-over-year increase in average monthly operating expense per subscriber, excluding sales and
marketing expenses and including integration expenses, on a pro forma basis, reflects Wireless’ increased spending on
handset upgrades associated with targeted retention programs and the impact of integration expenses resulting from
the acquisition of Fido.