Rogers 2005 Annual Report Download - page 104
Download and view the complete annual report
Please find page 104 of the 2005 Rogers annual report below. You can navigate through the pages in the report by either clicking on the pages listed below, or by using the keyword search tool below to find specific information within the annual report.-
 1
1 -
2
-
3
-
4
-
5
-
6
-
7
-
8
-
9
-
10
-
11
-
12
-
13
-
14
-
15
-
16
-
17
-
18
-
19
-
20
-
21
-
22
-
23
-
24
-
25
-
26
-
27
-
28
-
29
-
30
-
31
-
32
-
33
-
34
-
35
-
36
-
37
-
38
-
39
-
40
-
41
-
42
-
43
-
44
-
45
-
46
-
47
-
48
-
49
-
50
-
51
-
52
-
53
-
54
-
55
-
56
-
57
-
58
-
59
-
60
-
61
-
62
-
63
-
64
-
65
-
66
-
67
-
68
-
69
-
70
-
71
-
72
-
73
-
74
-
75
-
76
-
77
-
78
-
79
-
80
-
81
-
82
-
83
-
84
-
85
-
86
-
87
-
88
-
89
-
90
-
91
-
92
-
93
-
 94
94 -
 95
95 -
 96
96 -
 97
97 -
 98
98 -
 99
99 -
 100
100 -
 101
101 -
 102
102 -
 103
103 -
 104
104 -
 105
105 -
 106
106 -
 107
107 -
 108
108 -
 109
109 -
 110
110 -
 111
111 -
 112
112 -
 113
113 -
 114
114 -
115
-
116
-
117
-
118
-
119
-
120
-
121
-
122
-
123
-
124
-
125
-
126
-
127
-
128
-
129
-
130
-
131
-
132
-
133
-
134
-
135
-
136
-
137
-
138
-
139
-
140
-
141
-
142
-
143
-
144
-
145
-
146
-
147
-
148
-
149
-
150
-
151
-
152
-
153
-
154
 |
 |

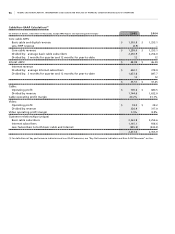
Years ended December 31, 2005 and 2004 2 0 0 5 2 0 0 4
Cash provided by (used in):
Operating activities:
Loss for the year $ (44,658) $ (67,142)
Adjustments to reconcile loss to net cash flows from operating activities:
Depreciation and amortization 1,478,011 1,092,551
Program rights and video rental inventory depreciation 90,184 88,328
Future income taxes (8,575) –
Non-controlling interest – 79,581
Unrealized foreign exchange loss (gain) (34,964) 66,943
Change in fair value of derivative instruments 25,168 (26,774)
Loss on repayment of long-term debt 11,242 28,210
Stock-based compensation expense 38,949 15,389
Accreted interest on Convertible Preferred Securities (note 2(s)(i)) 17,783 20,924
Amortization on fair value increment of long-term debt and derivatives (14,907) –
Other (6,818) 7,009
1,551,415 1,305,019
Change in non-cash working capital (note 10(a)) (324,008) (62,090)
1,227,407 1,242,929
Investing activities:
Additions to property, plant and equipment (“PP&E”) (1,353,796) (1,054,938)
Change in non-cash working capital related to PP&E (37,883) 59,994
Cash and cash equivalents acquired on acquisition
of Rogers Telecom Holdings Inc. (note 3(a)) 43,801 –
Acquisition of Rogers Wireless Communications Inc. (note 3(b)) – (1,772,840)
Acquisition of Microcell Telecommunications Inc.,
net of cash acquired (note 3(b)) (51,684) (1,148,637)
Investment in Toronto Blue Jays Baseball Club (note 7(a)) – (99,235)
Other acquisitions (38,092) (66,700)
Other 2,177 (2,566)
(1,435,477) (4,084,922)
Financing activities:
Issue of long-term debt 1,369,208 8,982,443
Repayment of long-term debt (1,509,577) (6,092,721)
Proceeds on termination of cross-currency interest rate
exchange agreements 402,191 58,416
Payment on termination of cross-currency interest rate
exchange agreements (470,825) (64,602)
Financing costs incurred (4,940) (66,071)
Issue of capital stock 100,348 302,231
Dividends paid on Class A Voting and Class B Non-Voting shares (26,209) (23,422)
(139,804) 3,096,274
Increase (decrease) in cash and cash equivalents (347,874) 254,281
Cash and cash equivalents (deficiency), beginning of year 243,993 (10,288)
Cash and cash equivalents (deficiency), end of year $ (103,881) $ 243,993
Cash and cash equivalents (deficiency) are defined as cash and short-term deposits, which have an original maturity of less than 90 days, less
bank advances.
For supplemental cash flow information and disclosure of non-cash transactions see note 10(b) and (c).
See accompanying notes to consolidated financial statements.
Consolidated Statements of Cash Flows
(I N TH OU S AN DS O F DOL LA R S)
100 ROGERS 2005 ANNUAL REPORT . CONSOLIDATED FINANCIAL STATEMENTS