Rogers 2005 Annual Report Download - page 46
Download and view the complete annual report
Please find page 46 of the 2005 Rogers annual report below. You can navigate through the pages in the report by either clicking on the pages listed below, or by using the keyword search tool below to find specific information within the annual report.-
 1
1 -
2
-
3
-
4
-
5
-
6
-
7
-
8
-
9
-
10
-
11
-
12
-
13
-
14
-
15
-
16
-
17
-
18
-
19
-
20
-
21
-
22
-
23
-
24
-
25
-
26
-
27
-
28
-
29
-
30
-
31
-
32
-
33
-
34
-
35
-
 36
36 -
 37
37 -
 38
38 -
 39
39 -
 40
40 -
 41
41 -
 42
42 -
 43
43 -
 44
44 -
 45
45 -
 46
46 -
 47
47 -
 48
48 -
 49
49 -
 50
50 -
 51
51 -
 52
52 -
 53
53 -
 54
54 -
 55
55 -
 56
56 -
57
-
58
-
59
-
60
-
61
-
62
-
63
-
64
-
65
-
66
-
67
-
68
-
69
-
70
-
71
-
72
-
73
-
74
-
75
-
76
-
77
-
78
-
79
-
80
-
81
-
82
-
83
-
84
-
85
-
86
-
87
-
88
-
89
-
90
-
91
-
92
-
93
-
94
-
95
-
96
-
97
-
98
-
99
-
100
-
101
-
102
-
103
-
104
-
105
-
106
-
107
-
108
-
109
-
110
-
111
-
112
-
113
-
114
-
115
-
116
-
117
-
118
-
119
-
120
-
121
-
122
-
123
-
124
-
125
-
126
-
127
-
128
-
129
-
130
-
131
-
132
-
133
-
134
-
135
-
136
-
137
-
138
-
139
-
140
-
141
-
142
-
143
-
144
-
145
-
146
-
147
-
148
-
149
-
150
-
151
-
152
-
153
-
154
 |
 |

42 ROGERS 2005 ANNUAL REPORT . MANAGEMENT’S DISCUSSION AND ANALYSIS OF FINANCIAL CONDITION AND RESULTS OF OPERATIONS
and reliability due to its bi-directional SONET ring architecture (a ‘self-healing’ system that allows for instantaneous
rerouting, virtually eliminating downtime in the event of a fibre cut). Telecom has generally installed more fibre optic
capacity than it expects to need for its own use, allowing it to generate revenue from the sale of capacity to others or to
increase the size and breadth of its network by swapping excess fibre for capacity on other routes.
Where Telecom does not have its own local facilities directly to a customer’s premises, it provides its local
services through a hybrid carrier strategy. It has deployed its own scalable switching and intelligent services infrastructure
while using connections between its co-located equipment and customer premises, provided largely by other carriers.
TE L E CO M ’S ST R A TE G Y
Telecom seeks to maximize revenue, operating income, and return on invested capital by leveraging its unique position
within the Canadian telecommunications market as facilities-based alternative to the ILECs for both residential and busi-
ness customers across Canada.
Telecom’s strategies to achieve this objective include identifying, developing, and exploiting profitable segments
within the Canadian telecommunications marketplace and differentiating itself through superior sales and customer
service. Telecom also seeks to leverage its relationships within the Rogers group of companies to provide bundled
product and service offerings at attractive prices, in addition to implementing cross-selling and joint sales distribution
initiatives as well as cost-reduction initiatives through infrastructure sharing.
Recent Wireline Telecom Industry Trends
IN D U ST R Y C ON S O LI D AT I ON A ND GR O WT H OF FA C ILI T IE S -B A SED CO M PE T ITO R S
The Canadian telecommunications industry has seen a consolidation of players in the wireline industry with the acquisi-
tions in 2004 and 2005 of 360/GT by BCE, Allstream by MTS and Call-Net by Rogers. Competition remains intense in the
long distance markets with average price per minute continuing to decline by over 10% per annum. Facilities-based
competitors in the local telephone market have emerged for the first time in the residential and small and medium-sized
business markets with the launch of competitive local telephone service by Canadian cable companies using their own
last mile facilities in 2005. Until 2005, competitors to the ILECs made use of resold ILEC facilities and services to provide retail
service in these markets. There has been very limited local facilities-based competition in the large enterprise market.
GR O W TH OF IN T E RN E T P RO T O CO L B A SE D SE R VI C ES
Another development has been the large-scale launch of Voice over Internet Protocol (“VoIP”) local services by non-
facilities-based providers in 2004 and 2005. These companies’ VoIP services are marketed to the subscribers of ILEC, cable
and other companies’ high-speed Internet services.
In the enterprise market, there is a continuing shift to IP-based services, in particular from ATM and frame relay
(two common data networks) to IP delivered through VPN services. This transition results in lower costs for both users
and carriers.
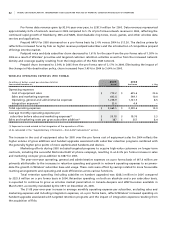
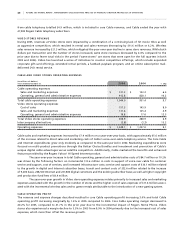
Telecom Operating and Financial Results
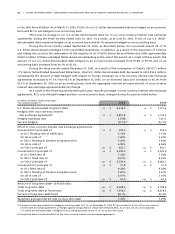
We began consolidating Telecom’s results effective July 1, 2005, the acquisition date. As discussed previously under the
“Basis of Pro Forma Information”, the pro forma information below has been prepared as if the transactions relating to
Telecom had occurred on January 1, 2004. We believe that this pro forma information including the operating and financial
results presented below for the six months ended December 31, 2004 presents a meaningful comparative analysis since
Telecom’s results are consolidated effective as of the July 1, 2005 acquisition date and the 2004 actual comparative figures
are nil. The pro forma comparative amounts reflect the harmonization of Telecom’s accounting policies with ours.
Telecom’s revenues primarily consist of:
• Consumer Services, which consist of revenue from retail and small and home office customers for long distance, home
phone and dial-up Internet services; and
• Business Services, which consist of revenue from small, medium and large-sized business and wholesale customers for
long distance, toll-free, teleconferencing, and enhanced voice solutions and data and IP-enabled solutions.