Rogers 2005 Annual Report Download - page 22
Download and view the complete annual report
Please find page 22 of the 2005 Rogers annual report below. You can navigate through the pages in the report by either clicking on the pages listed below, or by using the keyword search tool below to find specific information within the annual report.-
 1
1 -
2
-
3
-
4
-
5
-
6
-
7
-
8
-
9
-
10
-
11
-
 12
12 -
 13
13 -
 14
14 -
 15
15 -
 16
16 -
 17
17 -
 18
18 -
 19
19 -
 20
20 -
 21
21 -
 22
22 -
 23
23 -
 24
24 -
 25
25 -
 26
26 -
 27
27 -
 28
28 -
 29
29 -
 30
30 -
 31
31 -
 32
32 -
33
-
34
-
35
-
36
-
37
-
38
-
39
-
40
-
41
-
42
-
43
-
44
-
45
-
46
-
47
-
48
-
49
-
50
-
51
-
52
-
53
-
54
-
55
-
56
-
57
-
58
-
59
-
60
-
61
-
62
-
63
-
64
-
65
-
66
-
67
-
68
-
69
-
70
-
71
-
72
-
73
-
74
-
75
-
76
-
77
-
78
-
79
-
80
-
81
-
82
-
83
-
84
-
85
-
86
-
87
-
88
-
89
-
90
-
91
-
92
-
93
-
94
-
95
-
96
-
97
-
98
-
99
-
100
-
101
-
102
-
103
-
104
-
105
-
106
-
107
-
108
-
109
-
110
-
111
-
112
-
113
-
114
-
115
-
116
-
117
-
118
-
119
-
120
-
121
-
122
-
123
-
124
-
125
-
126
-
127
-
128
-
129
-
130
-
131
-
132
-
133
-
134
-
135
-
136
-
137
-
138
-
139
-
140
-
141
-
142
-
143
-
144
-
145
-
146
-
147
-
148
-
149
-
150
-
151
-
152
-
153
-
154
 |
 |

18 ROGERS 2005 ANNUAL REPORT . MANAGEMENT’S DISCUSSION AND ANALYSIS OF FINANCIAL CONDITION AND RESULTS OF OPERATIONS
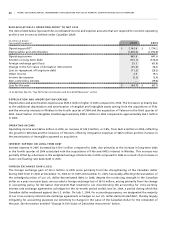
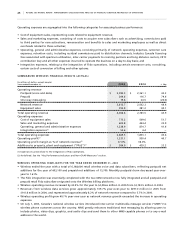
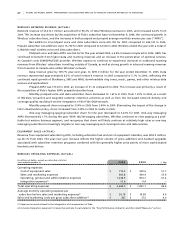
SUMMARIZED CONSOLIDATED FINANCIAL RESULTS
(In millions of dollars, except per share amounts and margin)
Years ended December 31, 2 0 0 5 2 0 0 4 % Chg
Operating revenue
Wireless $ 4,006.6 $ 2,783.5 43.9
Cable 2,067.7 1,945.7 6.3
Media 1,097.2 956.9 14.7
Telecom 423.9 – –
Corporate items and eliminations (113.2) (77.9) (45.3)
Total $ 7,482.2 $ 5,608.2 33.4
Operating expenses, including integration expenses(1)
Wireless $ 2,669.5 $ 1,833.1 45.6
Cable 1,349.1 1,237.0 9.1
Media 969.4 841.5 15.2
Telecom 378.0 – –
Corporate items and eliminations (27.4) (37.6) 27.1
Total $ 5,338.6 $ 3,874.0 37.8
Operating profit, after integration expenses(1)(2)
Wireless $ 1,337.1 $ 950.4 40.7
Cable 718.6 708.7 1.4
Media 127.8 115.4 10.7
Telecom 45.9 – –
Corporate items and eliminations (85.8) (40.3) (112.9)
Total $ 2,143.6 $ 1,734.2 23.6
Other income and expense, net(3) 2,188.3 1,801.3 21.5
Loss $ (44.7) $ (67.1) 33.4
Loss per share – basic and diluted $ (0.15) $ (0.28) (46.4)
Additions to PP&E(2)
Wireless(4) $ 584.9 $ 439.2 33.2
Cable 676.2 587.9 15.0
Media 39.6 20.3 95.1
Telecom 37.4 – –
Corporate items and eliminations 15.6 7.6 105.3
Total $ 1,353.7 $ 1,055.0 28.3
Operating profit margin(1)(2) 28.6% 30.9%
(1) Operating expenses and operating profit in 2005 include integration expenses of $66.5 million (2004 – $4.4 million).
(2) As defined. See the “Key Performance Indicators and Non-GAAP Measures” section and Supplementary Information for details of the
calculation.
(3) See the “Reconciliation of Operating Profit to Net Loss” section for details of these amounts.
(4) Wireless additions to property, plant and equipment (“PP&E”) in 2005 include capital expenditures related to Fido integration of $92.5 million.
Our consolidated revenue was $7,482.2 million in 2005, an increase of $1,874.0 million, or 33.4%, from $5,608.2 million
in 2004. Of the increase, Wireless contributed $1,223.1 million, Cable $122.0 million, Telecom $423.9 million, and Media
$140.3 million, offset by an increase in corporate eliminations of $35.3 million. Effective July 31, 2004, as more fully
described below, we began to consolidate the Blue Jays. As a result, equity losses of the Blue Jays for the first seven
months of 2004 are included in losses from investments accounted for by the equity method, and the financial results of
the Blue Jays for the last five months of 2004 and all of 2005 are consolidated with our Media operations.
Our consolidated operating profit was $2,143.6 million, an increase of $409.4 million, or 23.6%, from
$1,734.2 million in 2004. Of this increase, Wireless contributed $386.7 million, Cable $9.9 million, Telecom $45.9 million,