Rogers 2005 Annual Report Download - page 24
Download and view the complete annual report
Please find page 24 of the 2005 Rogers annual report below. You can navigate through the pages in the report by either clicking on the pages listed below, or by using the keyword search tool below to find specific information within the annual report.-
 1
1 -
2
-
3
-
4
-
5
-
6
-
7
-
8
-
9
-
10
-
11
-
12
-
13
-
 14
14 -
 15
15 -
 16
16 -
 17
17 -
 18
18 -
 19
19 -
 20
20 -
 21
21 -
 22
22 -
 23
23 -
 24
24 -
 25
25 -
 26
26 -
 27
27 -
 28
28 -
 29
29 -
 30
30 -
 31
31 -
 32
32 -
 33
33 -
 34
34 -
35
-
36
-
37
-
38
-
39
-
40
-
41
-
42
-
43
-
44
-
45
-
46
-
47
-
48
-
49
-
50
-
51
-
52
-
53
-
54
-
55
-
56
-
57
-
58
-
59
-
60
-
61
-
62
-
63
-
64
-
65
-
66
-
67
-
68
-
69
-
70
-
71
-
72
-
73
-
74
-
75
-
76
-
77
-
78
-
79
-
80
-
81
-
82
-
83
-
84
-
85
-
86
-
87
-
88
-
89
-
90
-
91
-
92
-
93
-
94
-
95
-
96
-
97
-
98
-
99
-
100
-
101
-
102
-
103
-
104
-
105
-
106
-
107
-
108
-
109
-
110
-
111
-
112
-
113
-
114
-
115
-
116
-
117
-
118
-
119
-
120
-
121
-
122
-
123
-
124
-
125
-
126
-
127
-
128
-
129
-
130
-
131
-
132
-
133
-
134
-
135
-
136
-
137
-
138
-
139
-
140
-
141
-
142
-
143
-
144
-
145
-
146
-
147
-
148
-
149
-
150
-
151
-
152
-
153
-
154
 |
 |
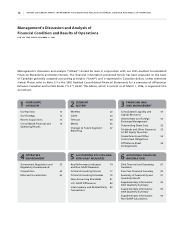
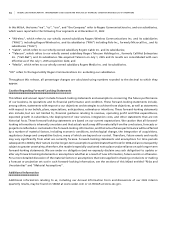
20 ROGERS 2005 ANNUAL REPORT . MANAGEMENT’S DISCUSSION AND ANALYSIS OF FINANCIAL CONDITION AND RESULTS OF OPERATIONS
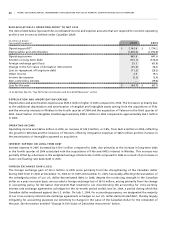
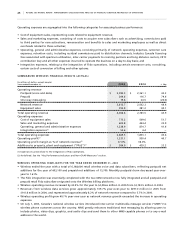
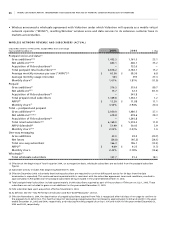
RE C O NC I LI A TI O N O F O P ER A T IN G P R OF I T T O N E T L O SS
The items listed below represent the consolidated income and expense amounts that are required to reconcile operating
profit to net income as defined under Canadian GAAP.
(In millions of dollars)
Years ended December 31, 2005 2004
Operating profit(1) $ 2,143.6 $ 1,734.2
Depreciation and amortization (1,478.0) (1,092.6)
Operating income 665.6 641.6
Interest on long-term debt (710.1) (576.0)
Foreign exchange gain (loss) 35.5 (67.6)
Change in the fair value of derivative instruments (25.2) 26.8
Loss on repayment of long-term debt (11.2) (28.2)
Other income 2.9 19.3
Income tax expense (2.2) (3.4)
Non-controlling interest – (79.6)
Loss for the year $ (44.7) $ (67.1)
(1) As defined. See the “Key Performance Indicators and Non-GAAP Measures” section.
DE P R EC I AT I ON A ND AM O RT I Z AT I ON EX P E NS E
Depreciation and amortization expense was $385.4 million higher in 2005 compared to 2004. The increase is primarily due
to the additional depreciation and amortization of tangible and intangible assets arising from the acquisitions of Fido
and the minority interests in Wireless in the fourth quarter of 2004 and the acquisition of Telecom in the third quarter of
2005. Amortization of intangibles totalled approximately $382.3 million in 2005 compared to approximately $64.3 million
in 2004.
OP E R AT I NG IN C O ME
Operating income was $665.6 million in 2005, an increase of $24.0 million, or 3.8%, from $641.6 million in 2004, reflecting
the growth in Wireless and the inclusion of Telecom, offset by integration expenses of $66.5 million and the increase in
the amortization of intangibles assumed on acquisition.
IN T E RE S T E XP E N SE ON LO N G -T E RM DE B T
Interest expense in 2005 increased by $134.1 million compared to 2004, due primarily to the increase in long-term debt
in the fourth quarter of 2004 associated with the acquisitions of Fido and AWE’s interest in Wireless. This increase was
partially offset by a decrease in the weighted average interest rate in 2005 compared to 2004 as a result of an increase in
lower cost floating rate bank debt in 2005.
FO R E IG N E X CH A N GE GA I N ( L OS S )
The foreign exchange gain of $35.5 million in 2005 arose primarily from the strengthening of the Canadian dollar
during 2005 from $1.2036 at December 31, 2004 to $1.1659 at December 31, 2005, favourably affecting the translation of
the unhedged portion of our U.S. dollar-denominated debt. In 2004, despite the continuing strength in the Canadian
dollar on a year-over-year basis, we recorded a foreign exchange loss of $67.6 million, arising primarily from the change
in accounting policy for derivative instruments that resulted in our discontinuing the accounting for cross-currency
interest rate exchange agreements as hedges for the six-month period ended June 30, 2004, a period during which the
Canadian dollar weakened against the U.S. dollar. On July 1, 2004, for accounting purposes, we designated the majority
of our cross-currency interest rate exchange agreements as hedges on our U.S. dollar-denominated debt, thereby largely
mitigating for accounting purposes our sensitivity to changes in the value of the Canadian dollar for the remainder of
the year. See the section entitled “Change in Fair Value of Derivative Instruments” below.