Rogers 2005 Annual Report Download - page 23
Download and view the complete annual report
Please find page 23 of the 2005 Rogers annual report below. You can navigate through the pages in the report by either clicking on the pages listed below, or by using the keyword search tool below to find specific information within the annual report.-
 1
1 -
2
-
3
-
4
-
5
-
6
-
7
-
8
-
9
-
10
-
11
-
12
-
 13
13 -
 14
14 -
 15
15 -
 16
16 -
 17
17 -
 18
18 -
 19
19 -
 20
20 -
 21
21 -
 22
22 -
 23
23 -
 24
24 -
 25
25 -
 26
26 -
 27
27 -
 28
28 -
 29
29 -
 30
30 -
 31
31 -
 32
32 -
 33
33 -
34
-
35
-
36
-
37
-
38
-
39
-
40
-
41
-
42
-
43
-
44
-
45
-
46
-
47
-
48
-
49
-
50
-
51
-
52
-
53
-
54
-
55
-
56
-
57
-
58
-
59
-
60
-
61
-
62
-
63
-
64
-
65
-
66
-
67
-
68
-
69
-
70
-
71
-
72
-
73
-
74
-
75
-
76
-
77
-
78
-
79
-
80
-
81
-
82
-
83
-
84
-
85
-
86
-
87
-
88
-
89
-
90
-
91
-
92
-
93
-
94
-
95
-
96
-
97
-
98
-
99
-
100
-
101
-
102
-
103
-
104
-
105
-
106
-
107
-
108
-
109
-
110
-
111
-
112
-
113
-
114
-
115
-
116
-
117
-
118
-
119
-
120
-
121
-
122
-
123
-
124
-
125
-
126
-
127
-
128
-
129
-
130
-
131
-
132
-
133
-
134
-
135
-
136
-
137
-
138
-
139
-
140
-
141
-
142
-
143
-
144
-
145
-
146
-
147
-
148
-
149
-
150
-
151
-
152
-
153
-
154
 |
 |

19 ROGERS 2005 ANNUAL REPORT . MANAGEMENT’S DISCUSSION AND ANALYSIS OF FINANCIAL CONDITION AND RESULTS OF OPERATIONS
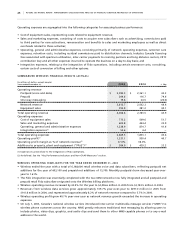
and Media $12.4 million of the operating profit increase. Consolidated operating profit as a percentage of operating
revenue (“operating profit margin”) decreased to 28.6% in 2005 from 30.9% in 2004. On a consolidated basis, we recorded
a net loss of $44.7 million for the year ended December 31, 2005, as compared to a net loss of $67.1 million in 2004.
Refer to the respective individual segment discussions for details of the revenue, operating expenses, operating
profit and additions to PP&E of Wireless, Cable, Telecom, and Media.
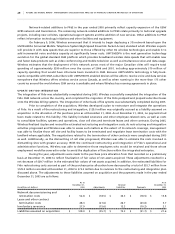
2005 Performance Against Targets
The following table sets forth the guidance ranges for selected full-year financial and operating metrics that we pro-
vided for 2005, as revised during the year, versus the actual results we achieved for the year. As indicated in the table,
we either met or exceeded our operating and financial targets in all categories.
2 0 0 5 2 0 0 5
(In millions of dollars, except subscribers) Guidance(1) Actual
Revenue
Wireless (network revenue) $ 3,560 to $ 3,600 $ 3,613
Cable 2,060 to 2,075 2,068
Media (excluding Sports Entertainment) 925 to 950 937
Sports Entertainment 150 to 160 160
Operating Profit(2)
Wireless(3) $ 1,350 to $ 1,390 $ 1,391
Cable(4) 710 to 725 719
Media (excluding Sports Entertainment) 130 to 140 139
Sports Entertainment (18) to (22) (11)
Capital Expenditures
Wireless(5) $ 475 to $ 500 $ 492
Cable 590 to 690 676
Net subscriber additions (000s)
Wireless voice and data 600,000 to 650,000 619,000
Basic cable Flat to down 1% from 2004 9,200
Internet subscribers 165,000 to 195,000 209,000
Digital subscribers 175,000 to 275,000 238,000
Fido integration costs
Non-recurring cash integration costs $ 185 to $ 215 $ 198
(1) As reaffirmed or revised October 25, 2005. Does not include July 1, 2005 acquisition of Telecom.
(2) Before management fees paid to RCI.
(3) Excluding costs related to Fido integration.
(4) Includes $19.2 million of losses associated with cable telephony launch.
(5) Excludes expenditures related to Fido integration.