Rogers 2005 Annual Report Download - page 91
Download and view the complete annual report
Please find page 91 of the 2005 Rogers annual report below. You can navigate through the pages in the report by either clicking on the pages listed below, or by using the keyword search tool below to find specific information within the annual report.-
 1
1 -
2
-
3
-
4
-
5
-
6
-
7
-
8
-
9
-
10
-
11
-
12
-
13
-
14
-
15
-
16
-
17
-
18
-
19
-
20
-
21
-
22
-
23
-
24
-
25
-
26
-
27
-
28
-
29
-
30
-
31
-
32
-
33
-
34
-
35
-
36
-
37
-
38
-
39
-
40
-
41
-
42
-
43
-
44
-
45
-
46
-
47
-
48
-
49
-
50
-
51
-
52
-
53
-
54
-
55
-
56
-
57
-
58
-
59
-
60
-
61
-
62
-
63
-
64
-
65
-
66
-
67
-
68
-
69
-
70
-
71
-
72
-
73
-
74
-
75
-
76
-
77
-
78
-
79
-
80
-
 81
81 -
 82
82 -
 83
83 -
 84
84 -
 85
85 -
 86
86 -
 87
87 -
 88
88 -
 89
89 -
 90
90 -
 91
91 -
 92
92 -
 93
93 -
 94
94 -
 95
95 -
 96
96 -
 97
97 -
 98
98 -
 99
99 -
 100
100 -
 101
101 -
102
-
103
-
104
-
105
-
106
-
107
-
108
-
109
-
110
-
111
-
112
-
113
-
114
-
115
-
116
-
117
-
118
-
119
-
120
-
121
-
122
-
123
-
124
-
125
-
126
-
127
-
128
-
129
-
130
-
131
-
132
-
133
-
134
-
135
-
136
-
137
-
138
-
139
-
140
-
141
-
142
-
143
-
144
-
145
-
146
-
147
-
148
-
149
-
150
-
151
-
152
-
153
-
154
 |
 |

87 ROGERS 2005 ANNUAL REPORT . MANAGEMENT’S DISCUSSION AND ANALYSIS OF FINANCIAL CONDITION AND RESULTS OF OPERATIONS
6 . A D D I T I O N A L F I N A N C I A L I N F O R M A T I O N
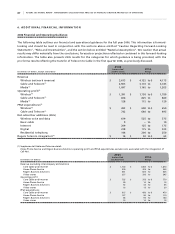
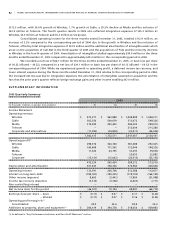
2006 Financial and Operating Guidance
The following table outlines our financial and operational guidance for the full year 2006. This information is forward-
looking and should be read in conjunction with the sections above entitled “Caution Regarding Forward-Looking
Statements”, “Risks and Uncertainties”, and the section below entitled “Material Assumptions”. We caution that actual
results may differ materially from the conclusions, forecasts or projections reflected or contained in this forward-looking
information. The table also presents 2005 results for the categories for which guidance is being provided, with the
pro forma results reflecting the transfer of Telecom to Cable in the first quarter 2006, as previously discussed.
2005
Reclassified 2006
(In millions of dollars, except subscribers) and Pro Forma Range
Revenue
Wireless (network revenue) $ 3,613 $ 4,125 to $ 4,175
Cable and Telecom(1) 2,925 3,110 to 3,185
Media(2) 1,097 1,165 to 1,205
Operating profit(3)
Wireless(4) $ 1,391 $ 1,730 to $ 1,780
Cable and Telecom(1) 834 825 to 860
Media(2) 128 115 to 120
PP&E expenditures(5)
Wireless(4) $ 492 $ 600 to $ 650
Cable and Telecom(1) 742 640 to 695
Net subscriber additions (000s)
Wireless voice and data 619 525 to 575
Basic cable 9 – to 10
Internet 209 125 to 175
Digital 238 175 to 225
Residential telephony 144 200 to 250
Rogers Telecom integration(6) $ 14 $ 50 to $ 65
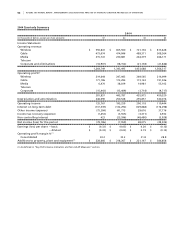
(1) Supplemental Cable and Telecom detail:
Home Phone Service and Rogers Business Solutions operating profit and PP&E expenditures exclude costs associated with the integration of
Call-Net.
2005
Reclassified 2006
(In millions of dollars) and Pro Forma Range
Revenue (excluding intercompany eliminations)
Core Cable and Internet $ 1,740 $ 1,850 to $ 1,870
Home Phone Service 300 325 to 345
Rogers Business Solutions 561 600 to 625
Video stores 327 335 to 345
Operating profit
Core Cable and Internet $ 725 $ 755 to $ 770
Home Phone Service 39 10 to 15
Rogers Business Solutions 52 45 to 55
Video stores 18 15 to 20
PP&E expenditures
Core Cable and Internet $ 515 $ 450 to $ 470
Home Phone Service 127 90 to 110
Rogers Business Solutions 86 90 to 100
Video stores 15 10 to 15