Rogers 2005 Annual Report Download - page 5
Download and view the complete annual report
Please find page 5 of the 2005 Rogers annual report below. You can navigate through the pages in the report by either clicking on the pages listed below, or by using the keyword search tool below to find specific information within the annual report.-
 1
1 -
 2
2 -
 3
3 -
 4
4 -
 5
5 -
 6
6 -
 7
7 -
 8
8 -
 9
9 -
 10
10 -
 11
11 -
 12
12 -
 13
13 -
 14
14 -
 15
15 -
 16
16 -
17
-
18
-
19
-
20
-
21
-
22
-
23
-
24
-
25
-
26
-
27
-
28
-
29
-
30
-
31
-
32
-
33
-
34
-
35
-
36
-
37
-
38
-
39
-
40
-
41
-
42
-
43
-
44
-
45
-
46
-
47
-
48
-
49
-
50
-
51
-
52
-
53
-
54
-
55
-
56
-
57
-
58
-
59
-
60
-
61
-
62
-
63
-
64
-
65
-
66
-
67
-
68
-
69
-
70
-
71
-
72
-
73
-
74
-
75
-
76
-
77
-
78
-
79
-
80
-
81
-
82
-
83
-
84
-
85
-
86
-
87
-
88
-
89
-
90
-
91
-
92
-
93
-
94
-
95
-
96
-
97
-
98
-
99
-
100
-
101
-
102
-
103
-
104
-
105
-
106
-
107
-
108
-
109
-
110
-
111
-
112
-
113
-
114
-
115
-
116
-
117
-
118
-
119
-
120
-
121
-
122
-
123
-
124
-
125
-
126
-
127
-
128
-
129
-
130
-
131
-
132
-
133
-
134
-
135
-
136
-
137
-
138
-
139
-
140
-
141
-
142
-
143
-
144
-
145
-
146
-
147
-
148
-
149
-
150
-
151
-
152
-
153
-
154
 |
 |

2
1
3
4
2005 2004 CHANGE
(i n mi ll i on s of d oll ar s , su bs cri be rs i n t ho us a nd s) (P ro F or m a)
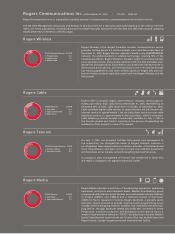
Network revenue $ 3,612.7 $ 3,010.7 20%
Operating profit (excluding integration expenses) 1,390.7 1,015.7 37%
PP&E expenditures 492.4 674.1 (27)%
Wireless voice and data subscribers: - Postpaid 4,818.2 4,184.1 15%
- Prepaid 1,349.8 1,334.1 1%
- Total 6,168.0 5,158.2 12%
Average monthly revenue per user ($): - Postpaid 63.56 59.74 6%
- Prepaid 13.20 13.67 (3)%
- Total 51.99 48.01 8%
Data revenue as % of network revenue 8.2% 5.1% 61%
Churn (%): - Postpaid 1.61 1.93 (17)%
- Prepaid 3.54 3.17 12%
- Total 2.05 2.25 (9)%
2
1
3
4
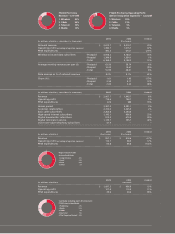
FY2005 Pro Forma
Revenue – $7,910M
1. Wireless 50%
2. Cable 26%
3. Telecom 10%
4. Media 14%
2
1
34
FY2005 Pro Forma Operating Profit
(before integration expenses) – $2,262M
1. Wireless 59%
2. Cable 31%
3. Telecom 5%
4. Media 5%
2005 2004 CHANGE
(i n mi ll i on s of d oll ar s ) (re st at e d)
Revenue $ 1,097.2 $ 956.9 15%
Operating profit 127.8 115.4 11%
PP&E expenditures 39.6 20.3 95%
(i n mi ll i on s of d oll ar s , su bs cri be rs i n t ho us a nd s) 2005 2004 CHANGE
Revenue $ 2,067.7 $ 1,945.7 6%
Operating profit 718.6 708.7 1%
PP&E expenditures 676 588 15%
Homes passed 3,387.5 3,291.1 3%
Customer relationships 2,413.0 2,355.9 2%
Basic cable subscribers 2,263.8 2,254.6 –
High-speed Internet subscribers 1,145.1 936.6 22%
Digital households / subscribers 913.2 675.4 35%
Digital terminals in service 1,139.7 795.7 43%
Voice-over-cable telephony subscribers 47.9 – –
2005 2004 CHANGE
(i n mi ll i on s of d oll ar s ) (P ro F or m a) (P r o Fo rm a )
Revenue $ 857.1 $ 818.6 4.7%
Operating profit (excluding integration expenses) 115.7 98.9 17%
PP&E expenditures 65.8 56.6 16.3%
2
1
3
4
5
Core Media (excluding Sports Entertainment)
FY2005 revenue breakdown
1. Publishing 29%
2. Radio 22%
3. OMNI 8%
4. Sportsnet 15%
5. The Shopping Channel 26%
Rogers Telecom FY2005
revenue breakdown
1. Long Distance 43%
2. Local 29%
3. Data 26%
4. Other 2%