Rogers 2005 Annual Report Download - page 43
Download and view the complete annual report
Please find page 43 of the 2005 Rogers annual report below. You can navigate through the pages in the report by either clicking on the pages listed below, or by using the keyword search tool below to find specific information within the annual report.-
 1
1 -
2
-
3
-
4
-
5
-
6
-
7
-
8
-
9
-
10
-
11
-
12
-
13
-
14
-
15
-
16
-
17
-
18
-
19
-
20
-
21
-
22
-
23
-
24
-
25
-
26
-
27
-
28
-
29
-
30
-
31
-
32
-
 33
33 -
 34
34 -
 35
35 -
 36
36 -
 37
37 -
 38
38 -
 39
39 -
 40
40 -
 41
41 -
 42
42 -
 43
43 -
 44
44 -
 45
45 -
 46
46 -
 47
47 -
 48
48 -
 49
49 -
 50
50 -
 51
51 -
 52
52 -
 53
53 -
54
-
55
-
56
-
57
-
58
-
59
-
60
-
61
-
62
-
63
-
64
-
65
-
66
-
67
-
68
-
69
-
70
-
71
-
72
-
73
-
74
-
75
-
76
-
77
-
78
-
79
-
80
-
81
-
82
-
83
-
84
-
85
-
86
-
87
-
88
-
89
-
90
-
91
-
92
-
93
-
94
-
95
-
96
-
97
-
98
-
99
-
100
-
101
-
102
-
103
-
104
-
105
-
106
-
107
-
108
-
109
-
110
-
111
-
112
-
113
-
114
-
115
-
116
-
117
-
118
-
119
-
120
-
121
-
122
-
123
-
124
-
125
-
126
-
127
-
128
-
129
-
130
-
131
-
132
-
133
-
134
-
135
-
136
-
137
-
138
-
139
-
140
-
141
-
142
-
143
-
144
-
145
-
146
-
147
-
148
-
149
-
150
-
151
-
152
-
153
-
154
 |
 |

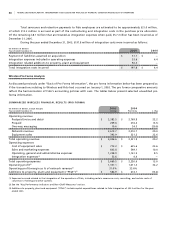
39 ROGERS 2005 ANNUAL REPORT . MANAGEMENT’S DISCUSSION AND ANALYSIS OF FINANCIAL CONDITION AND RESULTS OF OPERATIONS
from cable telephony totalled $4.9 million, which is included in core Cable revenue, and Cable ended the year with
47,900 Rogers Cable telephony subscribers.
VI D E O S TO R ES R EV E NU E
During 2005, revenues at Video stores were impacted by a combination of a continuing lack of hit movie titles as well
as aggressive competition, which resulted in rental and sales revenues decreasing by $11.6 million or 4.2%. Wireless
sales revenue increased by $21.3 million, which mitigated the year-over-year decline in same store revenues. While both
dollars per transaction and the number of stores increased, same store revenues decreased by 4.4% compared to the
prior year due to fewer total visits in the period (“same stores” are stores that were open for the full quarters in both
2005 and 2004). Video has launched a series of initiatives to counter competitive offerings, which include expanded
corporate gift-card offerings, extended rental periods, a fastback payback program, and an online subscription mail-
delivered DVD rental service.
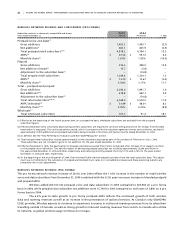
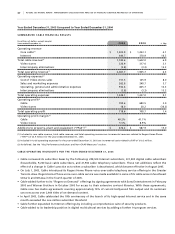
CA B L E A ND VI D E O S TO R ES O PE R AT I NG E XP E NS E S
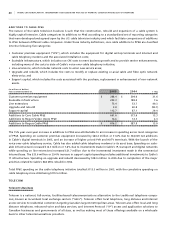
(In millions of dollars)
Years ended December 31, 2 0 0 5 2 0 0 4 % Chg
Cable operating expenses
Sales and marketing expenses $ 131.2 $ 123.3 6.4
Operating, general and administrative expenses 912.8 828.1 10.2
Total cable operating expenses 1,044.0 951.4 9.7
Video stores operating expenses
Cost of sales 157.5 145.9 8.0
Sales and marketing expenses 131.6 125.4 4.9
Operating, general and administrative expenses 19.8 17.6 12.5
Total Video stores operating expenses 308.9 288.9 6.9
Intercompany eliminations (3.8) (3.3) 15.2
Operating expenses $ 1,349.1 $ 1,237.0 9.1
Cable sales and marketing expenses increased by $7.9 million on a year-over-year basis, with approximately $5.6 million
of the increase related to direct sales and marketing costs of Cable’s voice-over-cable telephony service. The Core Cable
and Internet expenditures grew only modestly as compared to the same period in 2004. Marketing expenditures were
focused on multi-product promotions through the Better Choice Bundles and investment and promotion of Cable’s
unique digital cable advantages versus satellite competitors. Additionally, Cable marketed the benefits and enhanced
features provided by the Rogers Yahoo! Hi-Speed Internet product.
The year-over-year increase in total Cable operating, general and administrative costs of $84.7 million or 10.2%
was driven by the following factors: an incremental $13.6 million in costs in support of voice-over-cable for customer
service and support, cost of services, and increased infrastructure costs; service and support costs of $30.1 million related
to the growth in digital and Internet subscriber bases, transit and content costs of $32.6 million related to the increase
of 9,200 basic, 208,500 Internet and 237,800 digital customers and the existing subscriber base; as well as higher copyright
and production fund fees of $8.4 million.
The year-over-year growth in Video store operating expenses relates primarily to increased sales and marketing
expenses associated with the growth in the number of stores and the higher cost of sales expenses of $11.6 million associ-
ated with the incremental wireless sales and to game rentals attributable to the introduction of a new gaming system.
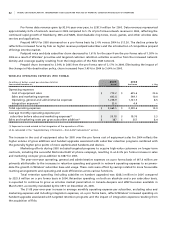
CA B L E O PE R AT I N G P RO F IT
The revenue and expense changes described resulted in core Cable operating profit increasing 3.0% and total Cable
operating profit increasing marginally by 1.4% in 2005 compared to 2004. Core Cable operating margin decreased to
40.2% for 2005, compared to 41.7% in the prior year due to the incremental impact of Rogers Home Phone. Video
stores also experienced a margin decline to 5.5% in 2005 from 8.9% in 2004 primarily due to the increased cost of sales
expenses, which more than offset the revenue growth.