Rogers 2005 Annual Report Download - page 29
Download and view the complete annual report
Please find page 29 of the 2005 Rogers annual report below. You can navigate through the pages in the report by either clicking on the pages listed below, or by using the keyword search tool below to find specific information within the annual report.-
 1
1 -
2
-
3
-
4
-
5
-
6
-
7
-
8
-
9
-
10
-
11
-
12
-
13
-
14
-
15
-
16
-
17
-
18
-
 19
19 -
 20
20 -
 21
21 -
 22
22 -
 23
23 -
 24
24 -
 25
25 -
 26
26 -
 27
27 -
 28
28 -
 29
29 -
 30
30 -
 31
31 -
 32
32 -
 33
33 -
 34
34 -
 35
35 -
 36
36 -
 37
37 -
 38
38 -
 39
39 -
40
-
41
-
42
-
43
-
44
-
45
-
46
-
47
-
48
-
49
-
50
-
51
-
52
-
53
-
54
-
55
-
56
-
57
-
58
-
59
-
60
-
61
-
62
-
63
-
64
-
65
-
66
-
67
-
68
-
69
-
70
-
71
-
72
-
73
-
74
-
75
-
76
-
77
-
78
-
79
-
80
-
81
-
82
-
83
-
84
-
85
-
86
-
87
-
88
-
89
-
90
-
91
-
92
-
93
-
94
-
95
-
96
-
97
-
98
-
99
-
100
-
101
-
102
-
103
-
104
-
105
-
106
-
107
-
108
-
109
-
110
-
111
-
112
-
113
-
114
-
115
-
116
-
117
-
118
-
119
-
120
-
121
-
122
-
123
-
124
-
125
-
126
-
127
-
128
-
129
-
130
-
131
-
132
-
133
-
134
-
135
-
136
-
137
-
138
-
139
-
140
-
141
-
142
-
143
-
144
-
145
-
146
-
147
-
148
-
149
-
150
-
151
-
152
-
153
-
154
 |
 |

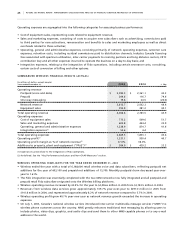
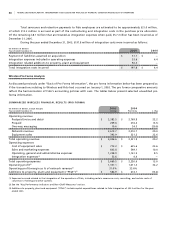
25 ROGERS 2005 ANNUAL REPORT . MANAGEMENT’S DISCUSSION AND ANALYSIS OF FINANCIAL CONDITION AND RESULTS OF OPERATIONS
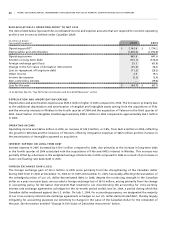
Operating expenses are segregated into the following categories for assessing business performance:
• Cost of equipment sales, representing costs related to equipment revenue;
• Sales and marketing expenses, consisting of costs to acquire new subscribers such as advertising, commissions paid
to third parties for new activations, remuneration and benefits to sales and marketing employees as well as direct
overheads related to these activities;
• Operating, general and administrative expenses, consisting primarily of network operating expenses, customer care
expenses, retention costs, including residual commissions paid to distribution channels, Industry Canada licencing
fees associated with spectrum utilization, inter-carrier payments to roaming partners and long distance carriers, CRTC
contribution levy and all other expenses incurred to operate the business on a day-to-day basis; and
• Integration expenses, relating to the integration of Fido operations, including certain severance costs, consulting,
certain costs of conversion of billing and other systems.
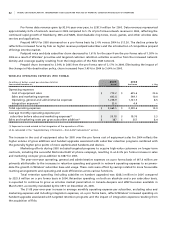
SU M M AR I ZE D W I R EL E SS FI N A NC I AL RE S U LT S ( A CTU A L)
(In millions of dollars, except margin)
Years ended December 31, 2 0 0 5 2 0 0 4 % Chg
Operating revenue
Postpaid (voice and data) $ 3,383.5 $ 2,361.1 43.3
Prepaid 209.6 116.7 79.6
One-way messaging 19.6 24.5 (20.0)
Network revenue 3,612.7 2,502.3 44.4
Equipment sales 393.9 281.2 40.1
Total operating revenue 4,006.6 2,783.5 43.9
Operating expenses
Cost of equipment sales 773.2 509.6 51.7
Sales and marketing expenses 603.8 444.4 35.9
Operating, general and administrative expenses 1,238.9 874.7 41.6
Integration expenses(1) 53.6 4.4 –
Total operating expenses 2,669.5 1,833.1 45.6
Operating profit(2) 1,337.1 950.4 40.7
Operating profit margin as % of network revenue(2) 37.0% 38.0%
Additions to property, plant and equipment (“PP&E”)(2) $ 584.9 $ 439.2 33.2
(1) Expenses incurred relate to the integration of Fido operations.
(2) As defined. See the “Key Performance Indicators and Non-GAAP Measures” section.
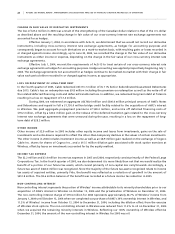
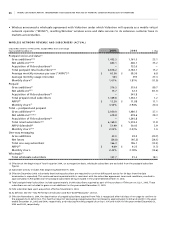
WI R E LE S S O PE R A TI N G H IG H L IG H TS FO R TH E Y E AR E ND E D D ECE M BE R 3 1 , 2 0 05
• Wireless ended the year with a total of 6,168,000 retail wireless voice and data subscribers, reflecting postpaid net
additions for the year of 603,100 and prepaid net additions of 15,700. Monthly postpaid churn decreased year-over-
year to 1.61%.
• The Fido integration was essentially completed with the two GSM networks now fully integrated and all postpaid and
prepaid retail Fido subscribers migrated onto the Wireless billing platforms.
• Wireless operating revenue increased by 43.9% for the year to $4,006.6 million in 2005 from $2,783.5 million in 2004.
• Revenues from wireless data services grew approximately 109.7% year-over-year to $297.0 million in 2005 from
$141.6 million in 2004, and represented approximately 8.2% of network revenue compared to 5.7% in 2004.
• Wireless operating profit grew 40.7% year-over-year as network revenue growth exceeded the increase in operating
expenses.
• On July 1, 2005, Canada’s national wireless carriers introduced inter-carrier multimedia message services (“MMS”) to
wireless phone customers across the country. MMS greatly enhances traditional text messaging by allowing users to
include photos, video clips, graphics, and audio clips and send them to other MMS-capable phones or to any e-mail
address in the world.