Rogers 2005 Annual Report Download - page 130
Download and view the complete annual report
Please find page 130 of the 2005 Rogers annual report below. You can navigate through the pages in the report by either clicking on the pages listed below, or by using the keyword search tool below to find specific information within the annual report.-
 1
1 -
2
-
3
-
4
-
5
-
6
-
7
-
8
-
9
-
10
-
11
-
12
-
13
-
14
-
15
-
16
-
17
-
18
-
19
-
20
-
21
-
22
-
23
-
24
-
25
-
26
-
27
-
28
-
29
-
30
-
31
-
32
-
33
-
34
-
35
-
36
-
37
-
38
-
39
-
40
-
41
-
42
-
43
-
44
-
45
-
46
-
47
-
48
-
49
-
50
-
51
-
52
-
53
-
54
-
55
-
56
-
57
-
58
-
59
-
60
-
61
-
62
-
63
-
64
-
65
-
66
-
67
-
68
-
69
-
70
-
71
-
72
-
73
-
74
-
75
-
76
-
77
-
78
-
79
-
80
-
81
-
82
-
83
-
84
-
85
-
86
-
87
-
88
-
89
-
90
-
91
-
92
-
93
-
94
-
95
-
96
-
97
-
98
-
99
-
100
-
101
-
102
-
103
-
104
-
105
-
106
-
107
-
108
-
109
-
110
-
111
-
112
-
113
-
114
-
115
-
116
-
117
-
118
-
119
-
 120
120 -
 121
121 -
 122
122 -
 123
123 -
 124
124 -
 125
125 -
 126
126 -
 127
127 -
 128
128 -
 129
129 -
 130
130 -
 131
131 -
 132
132 -
 133
133 -
 134
134 -
 135
135 -
 136
136 -
 137
137 -
 138
138 -
 139
139 -
 140
140 -
141
-
142
-
143
-
144
-
145
-
146
-
147
-
148
-
149
-
150
-
151
-
152
-
153
-
154
 |
 |

126 ROGERS 2005 ANNUAL REPORT . NOTES TO CONSOLIDATED FINANCIAL STATEMENTS
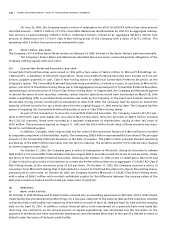
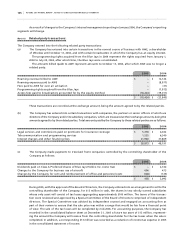
The balance of $188.0 million represented the value of the conversion feature of the Convertible Preferred
Securities and was recorded as a separate component of shareholders’ equity. As described in note 11(a)(iii), on
October 24, 2005, the Company issued 17,142,857 Class B Non-Voting shares and recorded contributed surplus for the
difference between the carrying values of the debt plus conversion feature and the total par value of the Class B Non-
Voting shares.
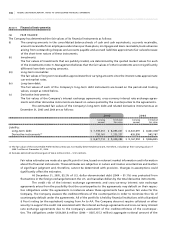
(c ) S T OCK OP T IO N AN D S H AR E PU R CH A SE P LA N S:
I. St o c k o pt i on p la n s:
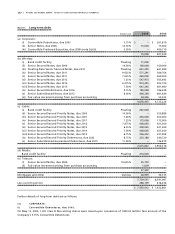
Details of the RCI stock option plan are as follows:
The Company’s stock option plan provides senior employee participants an incentive to acquire an equity own-
ership interest in the Company over a period of time and, as a result, reinforces executives’ attention on the long-term
interest of the Company and its shareholders. Under the plan, options to purchase Class B Non-Voting shares of the
Company on a one-for-one basis may be granted to employees, directors and officers of the Company and its affiliates
by the Board of Directors or by the Company’s Management Compensation Committee. There are 15 million options
authorized under the 2000 plan, 12.5 million options authorized under the 1996 plan, and 4.75 million options authorized
under the 1994 plan. The term of each option is 7–10 years; the vesting period is generally four years but may be adjusted
by the Management Compensation Committee on the date of grant. The exercise price for options is equal to the fair
market value of the Class B Non-Voting shares determined as the five-day average before the grant date as quoted on
The Toronto Stock Exchange.
On December 31, 2004, all stock options of Wireless were exchanged for options of RCI (note 3(b)).
On July 1, 2005, all stock options of Call-Net were exchanged for fully-vested options of RCI (note 3(a)).
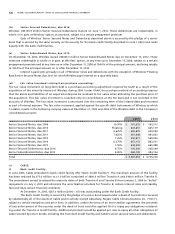
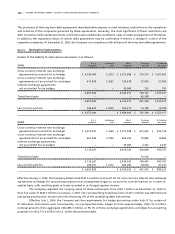
At December 31, 2005, a summary of the RCI option plan is as follows:
2005 2004
Weighted Weighted
average average
Number of exercise Number of exercise
options price per share options price per share
Outstanding, beginning of year 18,075,849 $ 18.37 18,981,033 $ 19.06
Granted 602,534 37.27 303,666 25.88
Exercised (5,398,036) 18.55 (4,019,485) 16.97
Forfeited (470,197) 21.36 (1,154,959) 26.62
Exchanged from Wireless options – – 3,965,594 15.48
Exchanged from Call-Net options 429,274 24.37 – –
Outstanding, end of year 13,239,424 19.24 18,075,849 18.37
Exercisable, end of year 9,570,203 $ 18.75 12,184,543 $ 18.69
At December 31, 2005, the range of exercise prices, the weighted average exercise price per share and the weighted
average remaining contractual life are as follows:
Options outstanding Options exercisable
Weighted
average Weighted Weighted
remaining average average
Range of Number contractual exercise Number exercise
exercise prices outstanding life (years) price per share exercisable price per share
$ 2.76 – $ 5.00 1,869 3.6 $ 2.76 1,869 $ 2.76
$ 5.78 – $ 8.92 2,393,115 2.0 6.53 2,360,302 6.52
$ 9.38 – $13.17 2,275,434 4.7 11.28 1,658,475 11.80
$ 14.83 – $20.59 1,722,454 7.2 16.88 663,156 17.38
$ 20.60 – $26.00 4,663,852 6.4 22.98 3,290,935 23.62
$ 26.01 – $38.18 2,004,728 4.6 34.50 1,595,466 34.63
$ 39.00 – $46.89 177,972 6.9 45.08 – –
13,239,424 5.2 $ 19.24 9,570,203 $ 18.75