Rogers 2005 Annual Report Download - page 140
Download and view the complete annual report
Please find page 140 of the 2005 Rogers annual report below. You can navigate through the pages in the report by either clicking on the pages listed below, or by using the keyword search tool below to find specific information within the annual report.-
 1
1 -
2
-
3
-
4
-
5
-
6
-
7
-
8
-
9
-
10
-
11
-
12
-
13
-
14
-
15
-
16
-
17
-
18
-
19
-
20
-
21
-
22
-
23
-
24
-
25
-
26
-
27
-
28
-
29
-
30
-
31
-
32
-
33
-
34
-
35
-
36
-
37
-
38
-
39
-
40
-
41
-
42
-
43
-
44
-
45
-
46
-
47
-
48
-
49
-
50
-
51
-
52
-
53
-
54
-
55
-
56
-
57
-
58
-
59
-
60
-
61
-
62
-
63
-
64
-
65
-
66
-
67
-
68
-
69
-
70
-
71
-
72
-
73
-
74
-
75
-
76
-
77
-
78
-
79
-
80
-
81
-
82
-
83
-
84
-
85
-
86
-
87
-
88
-
89
-
90
-
91
-
92
-
93
-
94
-
95
-
96
-
97
-
98
-
99
-
100
-
101
-
102
-
103
-
104
-
105
-
106
-
107
-
108
-
109
-
110
-
111
-
112
-
113
-
114
-
115
-
116
-
117
-
118
-
119
-
120
-
121
-
122
-
123
-
124
-
125
-
126
-
127
-
128
-
129
-
 130
130 -
 131
131 -
 132
132 -
 133
133 -
 134
134 -
 135
135 -
 136
136 -
 137
137 -
 138
138 -
 139
139 -
 140
140 -
 141
141 -
 142
142 -
 143
143 -
 144
144 -
 145
145 -
 146
146 -
 147
147 -
 148
148 -
 149
149 -
 150
150 -
151
-
152
-
153
-
154
 |
 |

136 ROGERS 2005 ANNUAL REPORT . NOTES TO CONSOLIDATED FINANCIAL STATEMENTS
Note 19. Financial instruments:
(a ) F AI R VA L UE S :
The Company has determined the fair values of its financial instruments as follows:
(i) The carrying amounts in the consolidated balance sheets of cash and cash equivalents, accounts receivable,
amounts receivable from employees under share purchase plans, mortgages and loans receivable, bank advances
arising from outstanding cheques and accounts payable and accrued liabilities approximate fair values because
of the short-term nature of these instruments.
(ii) Investments:
The fair values of investments that are publicly-traded, are determined by the quoted market values for each
of the investments (note 7). Management believes that the fair values of other investments are not significantly
different from their carrying amounts.
(iii) Long-term receivables:
The fair values of long-term receivables approximate their carrying amounts since the interest rates approximate
current market rates.
(iv) Long-term debt:
The fair values of each of the Company’s long-term debt instruments are based on the period-end trading
values, except as noted below.
(v) Derivative instruments:
The fair values of the Company’s interest exchange agreements, cross-currency interest rate exchange agree-
ments and other derivative instruments are based on values quoted by the counterparties to the agreements.
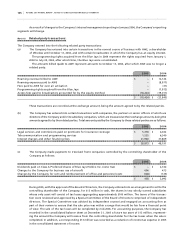
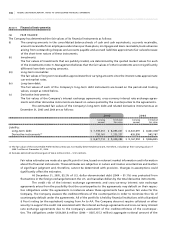
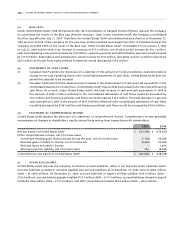
The estimated fair values of the Company’s long-term debt and related derivative instruments as at
December 31, 2005 and 2004 are as follows:
2005 2004
Carrying Estimated Carrying Estimated
amount fair value amount fair value
Liability:
Long-term debt $ 7,739,551 $ 8,095,057 $ 8,541,097 $ 8,861,038(1)
Derivative instruments(2) 738,161 1,335,337 626,896 945,767
$ 8,477,712 $ 9,430,394 $ 9,167,993 $ 9,806,805
(1) The fair value of the Convertible Preferred Securities was not readily determinable and are, therefore, included at their carrying value of
$490.7 million at December 31, 2004.
(2) Excludes deferred transitional gain of $63.4 million (2004 – $73.5 million).
Fair value estimates are made at a specific point in time, based on relevant market information and information
about the financial instruments. These estimates are subjective in nature and involve uncertainties and matters
of significant judgment and, therefore, cannot be determined with precision. Changes in assumptions could
significantly affect the estimates.
At December 31, 2005, 85.2% of U.S. dollar-denominated debt (2004 – 81.1%) was protected from
fluctuations in the foreign exchange between the U.S. and Canadian dollars by the total derivative instruments.
The credit risk of the interest exchange agreements and cross-currency interest rate exchange
agreements arises from the possibility that the counterparties to the agreements may default on their respec-
tive obligations under the agreements in instances where these agreements have positive fair value for the
Company. The Company assesses the creditworthiness of the counterparties in order to minimize the risk of
counterparty default under the agreements. All of the portfolio is held by financial institutions with a Standard
& Poor’s rating (or the equivalent) ranging from A+ to AA. The Company does not require collateral or other
security to support the credit risk associated with the interest exchange agreements and cross-currency interest
rate exchange agreements due to the Company’s assessment of the creditworthiness of the counterpar-
ties. The obligations under US$4,801.8 million (2004 – US$5,135.3 million) aggregate notional amount of the