Rogers 2005 Annual Report Download - page 115
Download and view the complete annual report
Please find page 115 of the 2005 Rogers annual report below. You can navigate through the pages in the report by either clicking on the pages listed below, or by using the keyword search tool below to find specific information within the annual report.-
 1
1 -
2
-
3
-
4
-
5
-
6
-
7
-
8
-
9
-
10
-
11
-
12
-
13
-
14
-
15
-
16
-
17
-
18
-
19
-
20
-
21
-
22
-
23
-
24
-
25
-
26
-
27
-
28
-
29
-
30
-
31
-
32
-
33
-
34
-
35
-
36
-
37
-
38
-
39
-
40
-
41
-
42
-
43
-
44
-
45
-
46
-
47
-
48
-
49
-
50
-
51
-
52
-
53
-
54
-
55
-
56
-
57
-
58
-
59
-
60
-
61
-
62
-
63
-
64
-
65
-
66
-
67
-
68
-
69
-
70
-
71
-
72
-
73
-
74
-
75
-
76
-
77
-
78
-
79
-
80
-
81
-
82
-
83
-
84
-
85
-
86
-
87
-
88
-
89
-
90
-
91
-
92
-
93
-
94
-
95
-
96
-
97
-
98
-
99
-
100
-
101
-
102
-
103
-
104
-
 105
105 -
 106
106 -
 107
107 -
 108
108 -
 109
109 -
 110
110 -
 111
111 -
 112
112 -
 113
113 -
 114
114 -
 115
115 -
 116
116 -
 117
117 -
 118
118 -
 119
119 -
 120
120 -
 121
121 -
 122
122 -
 123
123 -
 124
124 -
 125
125 -
126
-
127
-
128
-
129
-
130
-
131
-
132
-
133
-
134
-
135
-
136
-
137
-
138
-
139
-
140
-
141
-
142
-
143
-
144
-
145
-
146
-
147
-
148
-
149
-
150
-
151
-
152
-
153
-
154
 |
 |

111 ROGERS 2005 ANNUAL REPORT . NOTES TO CONSOLIDATED FINANCIAL STATEMENTS
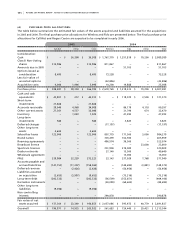
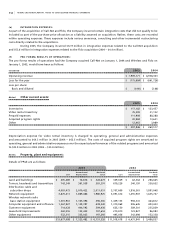
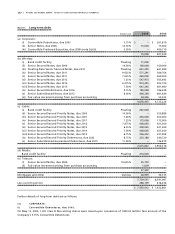
(d ) PU R CH A S E P RI C E A L LO C AT I ONS :
The table below summarizes the estimated fair values of the assets acquired and liabilities assumed for the acquisitions
in 2005 and 2004. The final purchase price allocations for Wireless and Fido are presented below. The final purchase price
allocations for Call-Net and Rogers Centre are expected to be completed in early 2006.
2005 2 0 0 4
Call-Net Other Total Wireless Fido Other Total
Consideration:
Cash $ – $ 36,308 $ 36,308 $ 1,767,370 $ 1,251,819 $ 70,200 $ 3,089,389
Class B Non-Voting
shares 315,986 – 315,986 811,867 – – 811,867
Amounts due in 2005 – – – – 51,705 – 51,705
Options issued as
consideration 8,495 – 8,495 73,228 – – 73,228
Less fair value of
unvested options – – – (43,896) – – (43,896)
Acquisition costs 4,000 1,996 5,996 10,200 14,888 – 25,088
Purchase price $ 328,481 $ 38,304 $ 366,785 $ 2,618,769 $ 1,318,412 $ 70,200 $ 4,007,381
Cash and cash
equivalents $ 43,801 $ 212 $ 44,013 $ – $ 118,070 $ 3,500 $ 121,570
Short-term
investments 21,666 – 21,666 – – – –
Accounts receivable 29,040 4,968 34,008 – 86,179 4,118 90,297
Other current assets 27,561 4,537 32,098 – 31,796 674 32,470
Inventory – 1,023 1,023 – 47,292 – 47,292
Long-term
investments 584 – 584 – 3,823 – 3,823
Deferred charges – – – (17,197) – – (17,197)
Other long-term
assets 4,604 – 4,604 – – – –
Subscriber bases 123,000 – 123,000 807,779 171,500 5,000 984,279
Brand names – – – 303,459 102,500 – 405,959
Roaming agreements – – – 486,574 36,500 – 523,074
Broadcast licence – – – – – 23,600 23,600
Spectrum licences – – – 201,909 319,000 – 520,909
Dealer networks – – – 27,140 13,500 – 40,640
Wholesale agreement – – – – 13,000 – 13,000
PP&E 339,984 32,239 372,223 33,143 337,029 7,768 377,940
Accounts payable and
accrued liabilities (147,153) (11,207) (158,360) – (144,692) (3,881) (148,573)
Deferred revenue – (2,426) (2,426) – (50,956) – (50,956)
Liabilities assumed
on acquisition (3,655) (5,997) (9,652) – (73,316) – (73,316)
Long-term debt (292,532) – (292,532) (56,509) (352,651) – (409,160)
Derivative instruments – – – (20,090) (64,602) – (84,692)
Other long-term
liabilities (9,396) – (9,396) – – – –
Non-controlling
interest – – – 290,878 – – 290,878
Fair value of net
assets acquired $ 137,504 $ 23,349 $ 160,853 $ 2,057,086 $ 593,972 $ 40,779 $ 2,691,837
Goodwill $ 190,977 $ 14,955 $ 205,932 $ 561,683 $ 724,440 $ 29,421 $ 1,315,544