Rogers 2005 Annual Report Download - page 37
Download and view the complete annual report
Please find page 37 of the 2005 Rogers annual report below. You can navigate through the pages in the report by either clicking on the pages listed below, or by using the keyword search tool below to find specific information within the annual report.-
 1
1 -
2
-
3
-
4
-
5
-
6
-
7
-
8
-
9
-
10
-
11
-
12
-
13
-
14
-
15
-
16
-
17
-
18
-
19
-
20
-
21
-
22
-
23
-
24
-
25
-
26
-
 27
27 -
 28
28 -
 29
29 -
 30
30 -
 31
31 -
 32
32 -
 33
33 -
 34
34 -
 35
35 -
 36
36 -
 37
37 -
 38
38 -
 39
39 -
 40
40 -
 41
41 -
 42
42 -
 43
43 -
 44
44 -
 45
45 -
 46
46 -
 47
47 -
48
-
49
-
50
-
51
-
52
-
53
-
54
-
55
-
56
-
57
-
58
-
59
-
60
-
61
-
62
-
63
-
64
-
65
-
66
-
67
-
68
-
69
-
70
-
71
-
72
-
73
-
74
-
75
-
76
-
77
-
78
-
79
-
80
-
81
-
82
-
83
-
84
-
85
-
86
-
87
-
88
-
89
-
90
-
91
-
92
-
93
-
94
-
95
-
96
-
97
-
98
-
99
-
100
-
101
-
102
-
103
-
104
-
105
-
106
-
107
-
108
-
109
-
110
-
111
-
112
-
113
-
114
-
115
-
116
-
117
-
118
-
119
-
120
-
121
-
122
-
123
-
124
-
125
-
126
-
127
-
128
-
129
-
130
-
131
-
132
-
133
-
134
-
135
-
136
-
137
-
138
-
139
-
140
-
141
-
142
-
143
-
144
-
145
-
146
-
147
-
148
-
149
-
150
-
151
-
152
-
153
-
154
 |
 |

33 ROGERS 2005 ANNUAL REPORT . MANAGEMENT’S DISCUSSION AND ANALYSIS OF FINANCIAL CONDITION AND RESULTS OF OPERATIONS
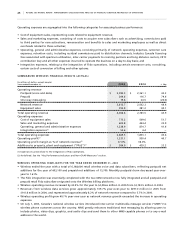
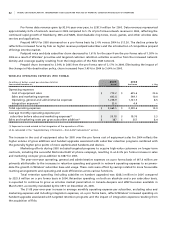
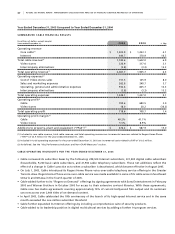
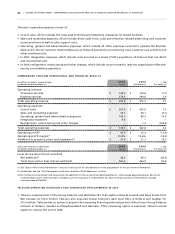
WI R E LE S S O PE R A TI N G P RO F I T ( PR O F O R MA )
Wireless operating profit increased by $325.8 million in 2005, or 32.2%, over operating profit on a pro forma basis for
2004 due to network revenue growth of 20.0%, offset by the growth in operating expenses, on a pro forma basis. This
resulted in an increase in the operating profit margin to 36.7% from 33.2% on a pro forma basis in 2004.
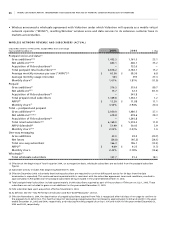
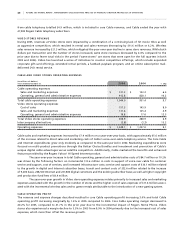
AD D I TI O NS TO W IR E LE S S P P &E (P R O F O RM A )
The following table presents actual and pro forma information about additions to Wireless property, plant and
equipment.
(In millions of dollars) 2 0 0 5 2 0 0 4
Years ended December 31, Actual Pro Forma % Chg
Additions to PP&E
Network – capacity $ 285.7 $ 450.8 (36.6)
Network – other 117.2 119.1 (1.6)
Information technology and other 89.5 104.2 (14.1)
Integration of Fido 92.5 – –
Total additions to PP&E $ 584.9 $ 674.1 (13.2)
Additions to Wireless PP&E for 2005 decreased by $89.2 million compared to pro forma additions in 2004. Additions to
Wireless PP&E in 2005 include $92.5 million of expenditures related to the Fido integration. This decrease is directly
attributable to reduced spending at Fido as a result of the acquisition.
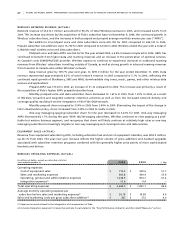
C A B L E
Cable’s Business
Cable is Canada’s largest cable television company, serving approximately 2.26 million basic subscribers at December 31,
2005, which represents approximately 29% of basic cable subscribers in Canada. At December 31, 2005, Cable provided
digital cable services to approximately 913,300 households, Internet service to approximately 1,145,100 subscribers, and
voice-over-cable telephony services to approximately 47,900 subscribers. Cable’s voice-over-cable telephony services
became commercially available on July 1, 2005.
Cable has highly-clustered and technologically advanced broadband networks in Ontario, New Brunswick
and Newfoundland and Labrador. Its Ontario cable systems, which comprise approximately 89% of its approximately
2.26 million basic cable subscribers, are concentrated in and around three principal clusters: (i) the Greater Toronto Area,
Canada’s largest metropolitan centre; (ii) Ottawa, the capital city of Canada, and (iii) the Guelph to London corridor in
southern Ontario. Cable’s New Brunswick and Newfoundland and Labrador cable systems in Atlantic Canada comprise
the balance of its subscribers.
CA B L E’ S P R OD U C TS AN D S E R VI C ES
Through its technologically advanced broadband networks, Cable offers a diverse range of services, including analog
and digital cable, residential and commercial Internet services, and voice-over-cable telephony services.
At December 31, 2005, more than 93% of Cable’s network was upgraded to transmit 750 MHz of bandwidth
or greater, which represents 100% completion of all urban areas served, and approximately 85% of its network was
upgraded to transmit 860 MHz of bandwidth. With approximately 99% of its network offering digital cable services,
Cable has a richly featured and highly-competitive video offer which includes high-definition television (“HDTV”),
video-on-demand (“VOD”), subscription video-on-demand (“SVOD”), personal video recorders (“PVR”), time-shifted
programming, pay-per-view (“PPV”) movies and events, as well as a significant line-up of digital specialty, multicultural
and sports programming. VOD services are available to approximately 91% of the homes passed by Cable’s network.
Cable’s Internet services are available to over 96% of homes passed by its network. It offers multiple tiers of
Internet services under the Rogers Yahoo! brand, differentiated largely by modem bandwidth settings. Cable also offers
a wide range of data and Internet products to business customers.